Bulls could not seize the initiative for a long time and, as a result, most of the coins have come back to the bearish zone. XRP is the only gainer, rising by 1% since yesterday.
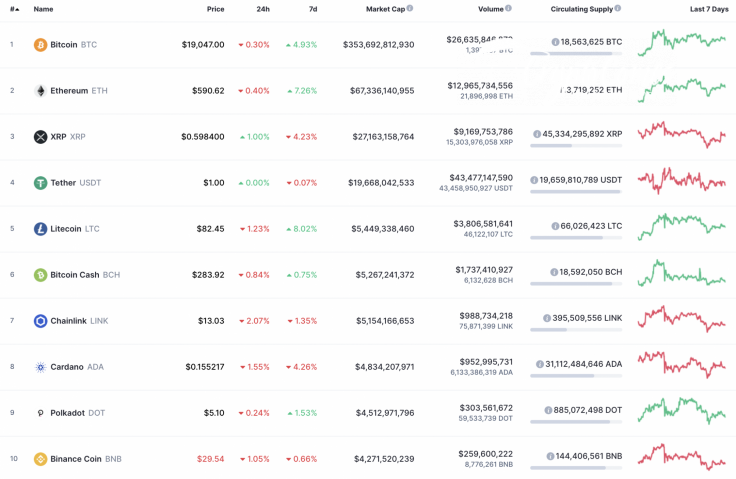
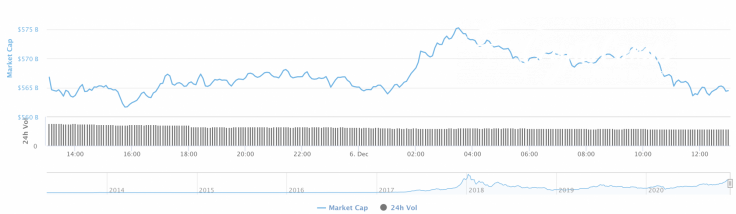
The capitalization market has also been affected by the decline of some coins and declined by around $2 bln; it is now at $564 bln.
The relevant data for Bitcoin today:
-
Name: Bitcoin
-
Ticker: BTC
-
Market Cap: $353,408,265,775
-
Price: $19,037.68
-
Volume (24h): $26,460,814,684
-
Change (24h): -0.52%
The data is relevant at press time.
BTC/USD: How much time do bulls need to conquer the $20,000 mark?
The last day of the week might be bearish for Bitcoin (BTC) as buyers have failed to fix above $19,000 after yesterday's bounce back from $18,500.
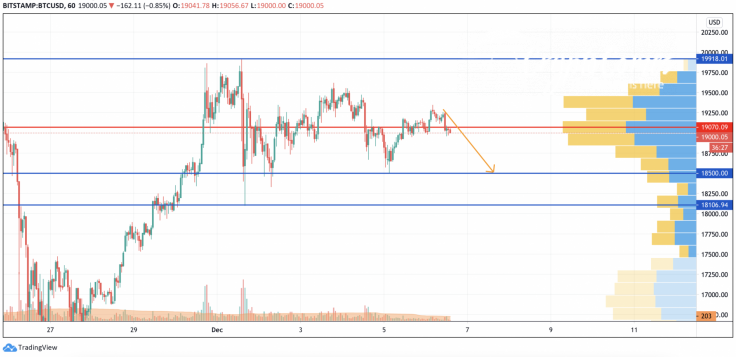
On the hourly chart, Bitcoin (BTC) has entered the correction phase, which is confirmed by selling trading volume and low liquidity above $19,500. The first stop at which bulls may try to seize the initiative is the support at $18,500. Such a scenario is relevant for the next several hours.
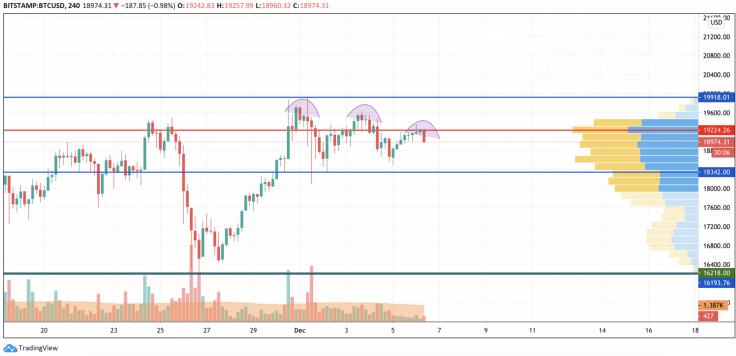
The bearish short-term perspective is also relevant on the longer time frame. On the 4H chart, there are lowering highs, which means that buyers are not ready to continue the bull run from the current levels.

Even though bears have not seized the initiative in the long-term projection, they are currently dominating based on high selling trading volume. The nearest zone in which a reversal might occur is the zone around $18,300.

On the daily time frame, Bitcoin (BTC) has formed a bearish divergence on the RSI indicator, which is a signal of a correction. The upcoming decline is also confirmed by the low trading volume and liquidity level. In this case, bulls need to gain more power after a possible drop to the support at $17,879.
Bitcoin is trading at $19,054 at press time.


