The weekend has begun with a bearish mood on the cryptocurrency market as almost all Top 10 coins are in the red zone. Cardano (ADA) is the only exception to the rule, rising by 1.70%.
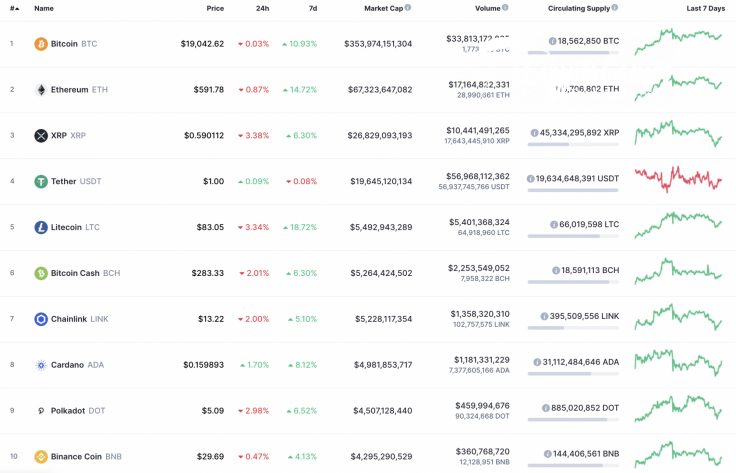
The vital data for Bitcoin (BTC), Ethereum (ETH) and XRP:
|
Name |
Ticker |
Market Cap |
Price |
Volume (24h) |
Change (24h) |
|
Bitcoin |
BTC |
$353,974,151,304 | $19,034.89 | $33,813,172,835 | -0.15% |
|
Ethereum |
ETH |
$67,323,647,082 | $591.46 | $17,164,822,331 | -0.80% |
|
XRP |
XRP |
$26,829,093,193 | $0.590163 | $10,441,491,265 | -2.89% |
BTC/USD
Despite yesterday’s drop of Bitcoin (BTC), the rate of the leading crypto has dropped by only 0.15% since yesterday.

On the daily chart, Bitcoin (BTC) has been trading sideways, expecting a breakout soon. Yesterday, the selling volume was at a low level, which means that bears have a low chance of seizing the initiative in the long-term perspective.
To sum up, the breakout of the peak at around $19,900 remains the relevant scenario for the upcoming days.
Bitcoin is trading at $19,044 at press time.
ETH/USD
Ethereum (ETH) is still dominated by bears as the price of the main altcoin has gone down by almost 1%, while the rate change over the last week has accounted for +14.72%.
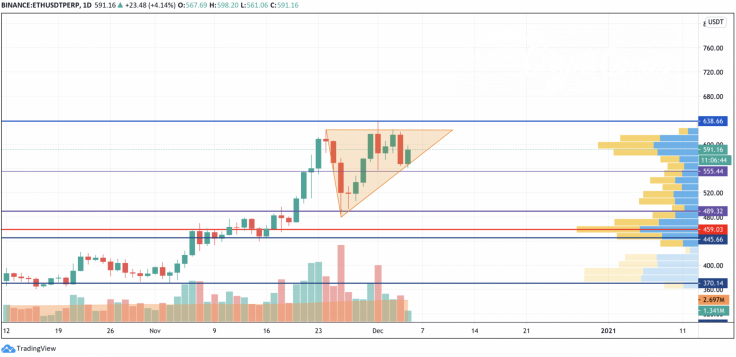
Ethereum (ETH) is following Bitcoin (BTC) as the long-term bullish trend has not been broken yet. The liquidity level remains high, which confirms the buyers' potential to keep the growth. Thus, the Ttriangle pattern has been formed, the breakout of which will confirm the retest of the resistance at $638.
Ethereum is trading at $590.02 at press time.
XRP/USD
XRP is the main loser today. The rate of the third most popular crypto has gone down by 2.89% over the previous 24 hours.
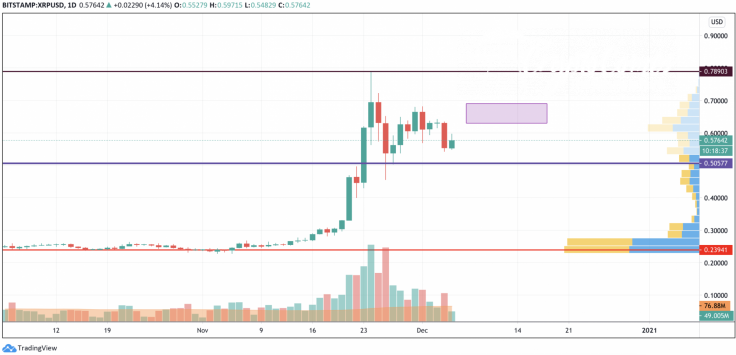
From the technical point of view, XRP has not accumulated enough power to set new peaks. The trading volume, as well as the liquidity levels, remain low, which means that buyers need more time for a price blast. That is why trading in the range of $0.63-$0.69 is the more likely scenario for the upcoming days.
XRP is trading at $0.5769 at press time.


