The negative mood continues on the cryptocurrency market as all coins from the Top 10 list are in the red zone. Polkadot (DOT) is the top loser among them, falling by almost 7%.
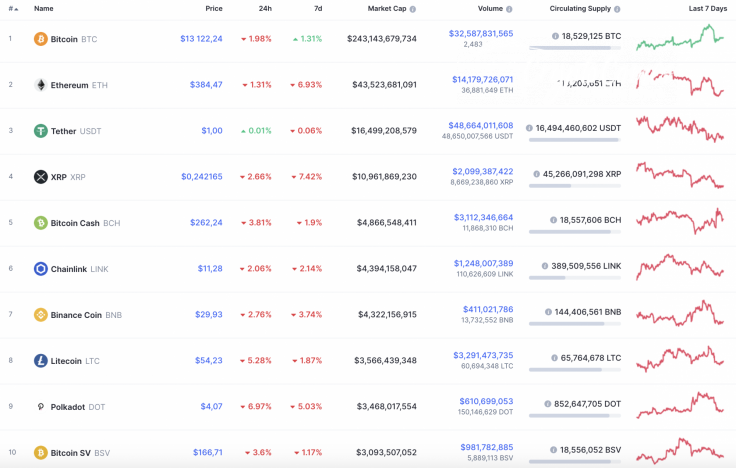
The vital data on Bitcoin (BTC), Bitcoin Cash (BCH) and Binance Coin (BNB) today:
|
Name |
Ticker |
Market Cap |
Price |
Volume (24h) |
Change (24h) |
|
Bitcoin |
BTC |
$243,143,679,734 | $13,122.24 | $32,587,831,565 | -1.98% |
|
Bitcoin Cash |
BCH |
$4,866,548,411 | $262.24 | $3,112,346,664 | -3.81% |
|
Binance Coin |
BNB |
$4,322,156,915 | $29.93 | $411,021,786 | -2.76% |
BTC/USD
Yesterday morning, the bulls could not continue the rise and the price of Bitcoin (BTC) retraced below the 61.8% Fibo level ($13,346). In the second half of the day, sellers pierced the support of the blue trendline but, before the end of the day, buyers recovered and held the pair at the lower border of the rising channel.
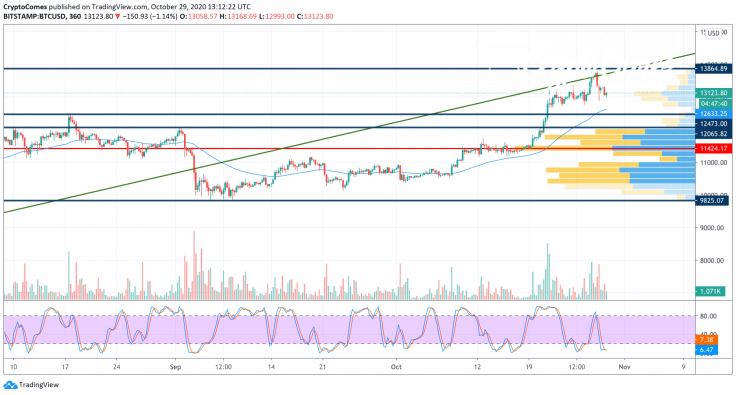
To continue the growth, buyers today need to fight again for the 61.8% Fibonacci level. Breaking this resistance in an overheated market will not be easy.
On the other hand, there is a possibility that the indicator lines may continue to decline to the lower border of the neutral zone. Therefore, there is reason to believe that the BTC price will not be able to stay in the ascending channel and will continue to roll back to the support of $12,800.
Bitcoin is trading at $13,125 at press time.
BCH/USD
Bitcoin Cash (BCH) is the main loser today as the price of the altcoin has dropped by 3.81%.
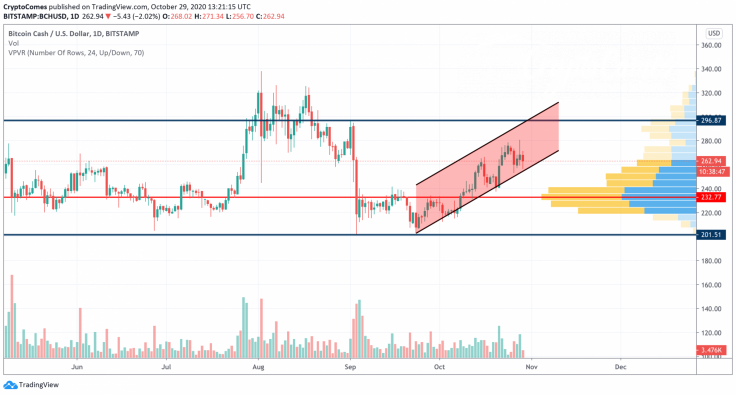
On the daily chart, Bitcoin Cash (BCH) is looking stronger than other coins. The cryptocurrency is still trading in the rising channel without any correction signals. If the trading volume remains at the same level, there is a high chance of seeing BCH trading at the resistance around $296 in the first part of November.
Bitcoin Cash is trading at $264.34 at press time.
BNB/USD
Binance Coin (BNB) has also lost a significant part of its price share over the last day. The price change has accounted for -2.76%.
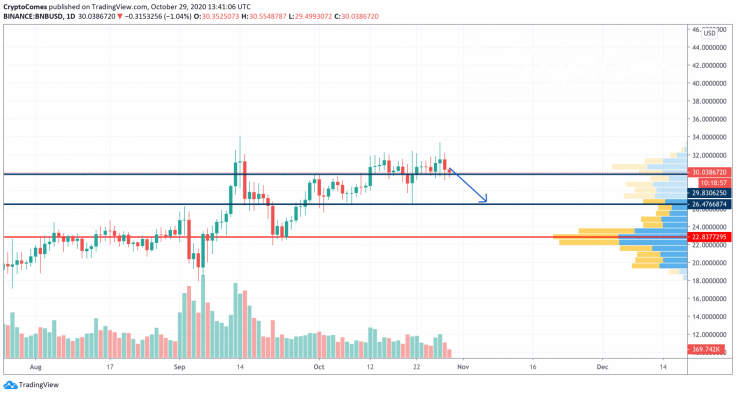
Even though the rate of Binance Coin (BNB) has significantly dropped today, it has not found the local support so far. There was no reaction to the false breakout, which means that bears may keep pushing the price deeper. Moreover, the selling trading volume is increasing. In this case, traders may see BNB at the range of $22-$26 soon, where most of the liquidity is focused.
Binance Coin is trading at $30.06 at press time.


