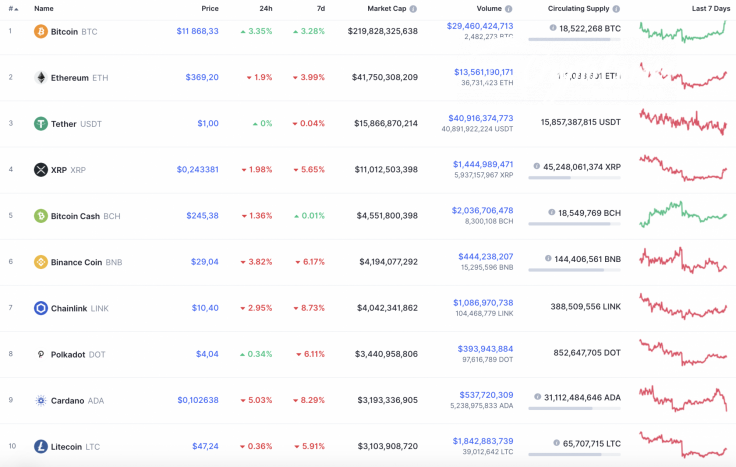
The situation on the cryptocurrency market has become less positive over the last few days. Most of the coins that were in the green zone have switched to red. The only crypto that keeps rising is Bitcoin (BTC), whose rate has increased by 3.35% since yesterday.
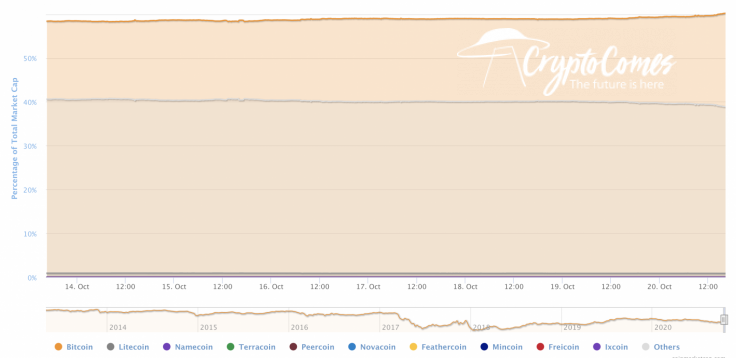
Against the falling of altcoins, the dominance rate of Bitcoin (BTC) has surpassed the 60% mark and now is 60.2%.
The relevant data of Bitcoin for today:
-
Name: Bitcoin
-
Ticker: BTC
-
Market Cap: $219,428,671,094
-
Price: $11,846.75
-
Volume (24h): $29,313,900,487
-
Change (24h): 3.02%
The data is relevant at press time.
BTC/USD: Should one expect a false breakout of the $12,000 mark?
Yesterday, buyers consolidated above the 50% fib ($11,394) and, in the afternoon, they were able to form a bullish momentum that forced the price of Bitcoin (BTC) to test the upper border of the expanding blue range. The daily high is set at $11,840.
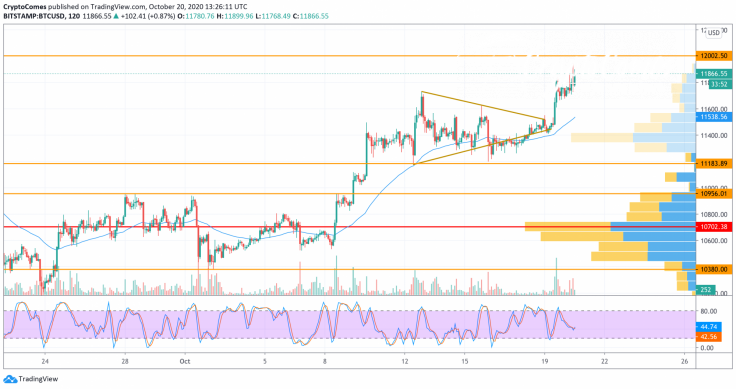
At night, the bulls did not manage to continue their growth. The price of Bitcoin rolled back to the area of $11,700 and is trying to find support. The Stoch RSI indicator shows some potential for further growth. A retest of the psychological level of $12,000 is possible today.
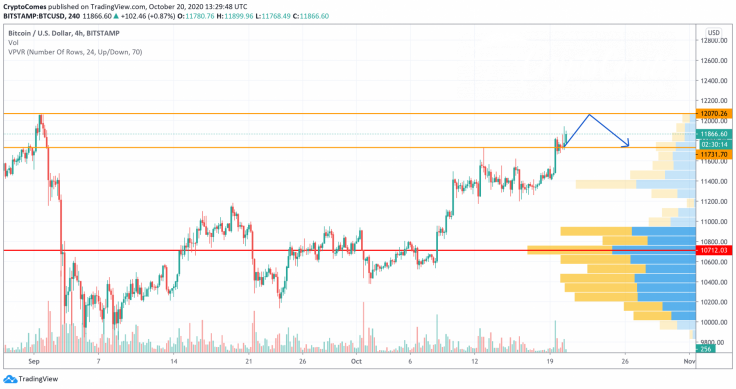
On the 4H chart, a strong resistance has been formed around $12,000. From the technical perspective, ongoing growth is possible to the level of $12,100.

However, bulls are unlikely to fix there as they lack power according to the low liquidity. In this case, the chief crypto may face a decline to $11,700 shortly.
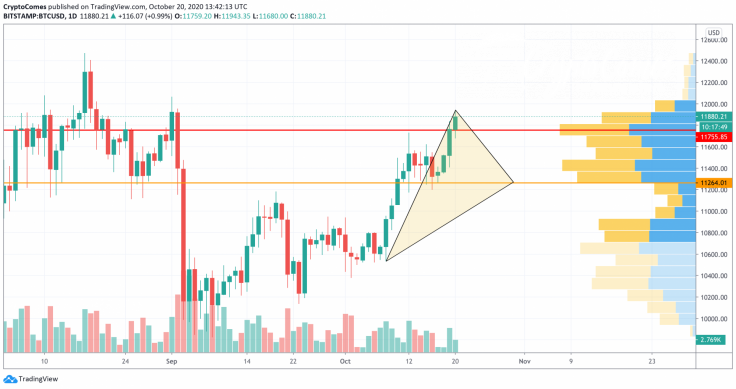
On the bigger time frame, the situation is even more bearish as Bitcoin (BTC) is forming a triangle pattern. The decreasing buying volume, as well as the relatively low liquidity, do not consider the rise of the first crypto above $12,000. That is why the decline to the crucial support at $11,100 may occur soon.
Bitcoin is trading at $11,875 at press time.


