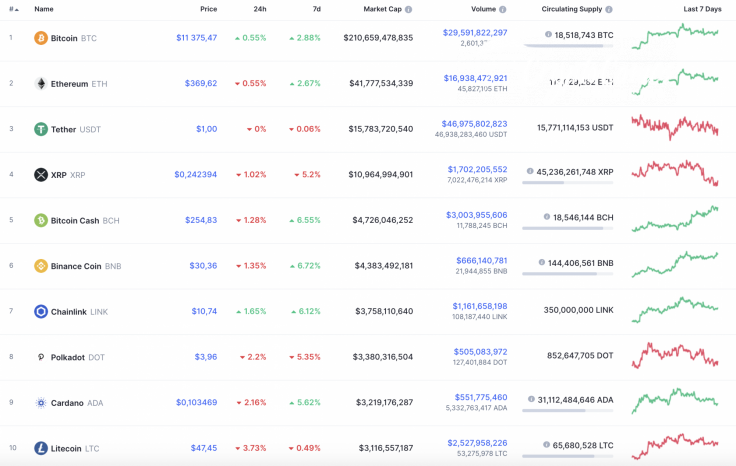
The market situation has barely seen any changes. Chainlink (LINK) and Bitcoin (BTC) are the only coins in the top 10 list that are located in the green zone.
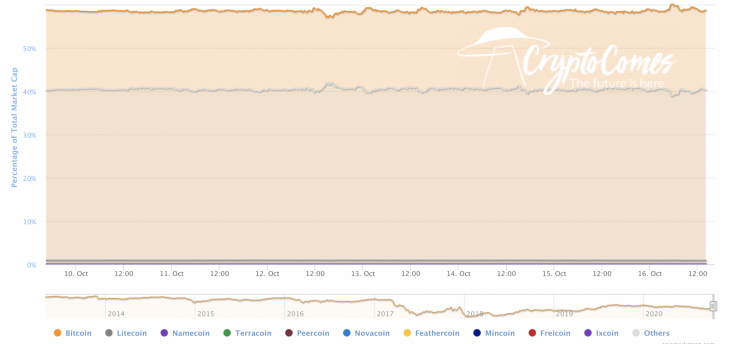
As altcoins are falling faster than Bitcoin (BTC), the market share of the leading crypto has strengthened, inching closer to the 59 percent mark at the moment.
The relevant Bitcoin data is looking the following way:
-
Name: Bitcoin
-
Ticker: BTC
-
Market Cap: $210,411,020,406
-
Price: $11 362,06
-
Volume (24h): $29,618,738,679
-
Change (24h): 0.36%
The data is relevant at the press time.
BTC/USD: Is the Power Enough to Reach $12,000 this Time?
Selling volumes topped the average mark yesterday morning and the price pulled back just below the two-hour EMA55. Despite the efforts of the sellers, Bitcoin (BTC) failed to test the support of $11,200 and immediately recovered above the 50 percent Fibonacci level ($11,394.15) after reaching the daily low of $11,250.
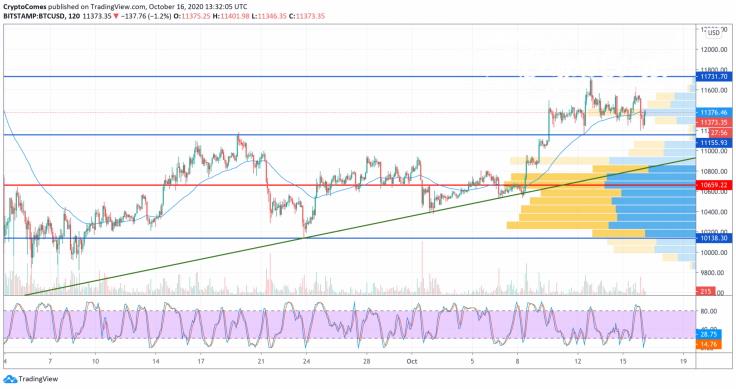
At the end of the day, the pair tested the level of $11,600 but it failed to sustain its growth at night. This morning, the price is consolidating around the $11,500 mark.
If market makers push below the $11,000 mark, then the BTC price will break below the lower trendline of the ascending channel, and it will be quite difficult for the top coin to recover it the medium term.

On the four-hour chart, the quotes were able to leave the triangle formation. There is every chance to see the continuation of the price growth within the framework of its development. An additional signal in favor of this option is the rebound from the lower border of the ascending channel and support on the RSI indicator.
As one can see, the previous test of the trendline on the indicator chart caused a substantial upward price move. In cast of an invalidation, traders can a breakdown of the lower line of the ascending channel with the price being fixed below the $10,960 level. This might indicate its further decline to the $10,350 level.
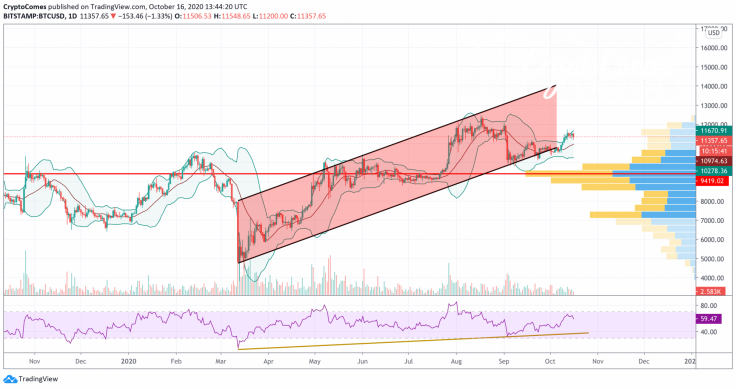
On the daily time frame, the quotes broke through the upper line of the corridor, in which the asset was squeezed for a long time, and consolidated above the level of $11,200. Here, the upper line of the descending channel has been crossed, which indicates the asset's desire to move upward, to the level of $12,495. The bulls can also find comfort in the fact that the values of the RSI indicator currently represent a rising trend line.
Bitcoin is trading at $11,350 at press time.


