The situation on the cryptocurrency market has improved over the last day as all Top 10 coins are again in the green zone. Cardano (ADA) is the main gainer from the list, whose rate has increased by 8.45%.
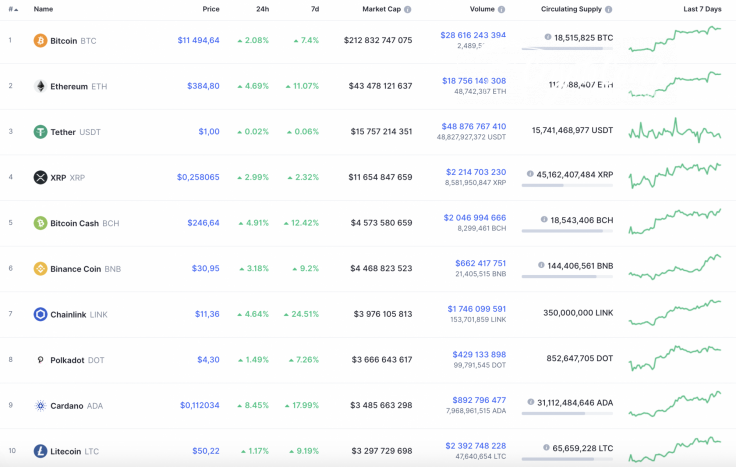
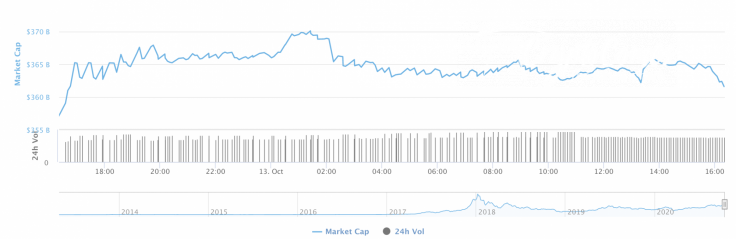
The rise of most of the coins has affected the total market capitalization, which has risen by $5 bln and is now $364 bln.
The relevant data for Bitcoin today:
-
Name: Bitcoin
-
Ticker: BTC
-
Market Cap: $211,307,158,427
-
Price: $11,411.72
-
Volume (24h): $22,633,304,043
-
Change (24h): -0.97%
The data is relevant at press time.
BTC/USD: Can bulls get to $12,000 before an upcoming drop?
Yesterday morning, the pressure from the bears began to build up, and in the afternoon the Bitcoin (BTC) price had already pierced the support of $11,200.

However, in the afternoon, after a retest of the two-hour EMA55, bulls seized the initiative and formed a rather powerful bullish momentum. Bitcoin (BTC) has broken through the 50% Fibonacci level, which kept it in a sideways range over the weekend.
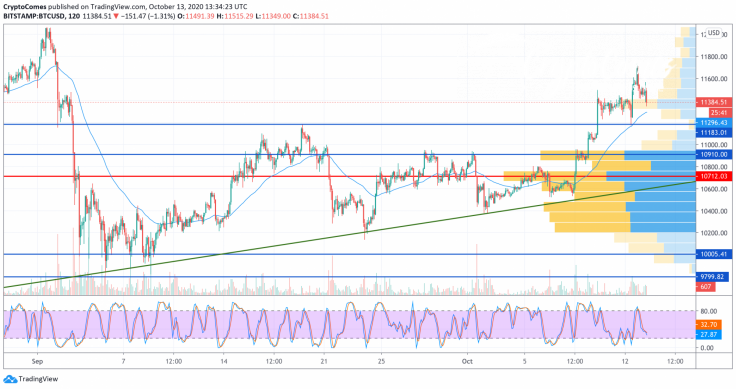
At the end of the day, the pair set a maximum around the level of $11,730, while at night the trading volumes decreased and the price fixed above the 50% Fibo level ($11,394). If the bulls manage to form a second impulse, then the cryptocurrency will test the psychological level of $12,000. But the pair may not be able to hold above the 50% Fibonacci level for a long time. Most likely, BTC will return to the area of average prices in the near future.
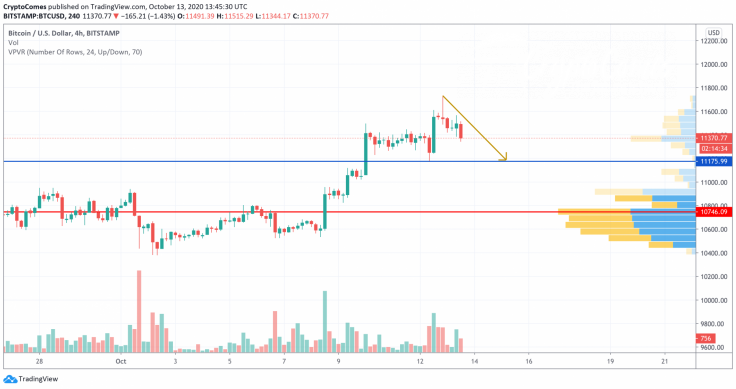
On the 4H chart, bulls still control the situation. However, a slight correction is possible to the zone of $11,200 to gain liquidity for a further price rise. The long-term bearish scenario will come into force if Bitcoin (BTC) can fix below the $11,000 mark.
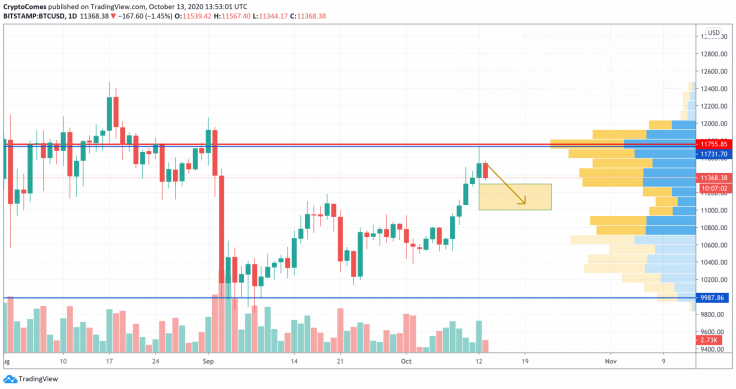
On the daily time frame, Bitcoin (BTC) is about to locate in the range between $11,000 and $11,300 before, bulls or bears will take the initiative. The trading volume is going down, which means that the decline to the aforementioned level is possible by the end of the current week.
Bitcoin is trading at $11,345 at press time.


