On the last day of the week, the situation has completely changed on the cryptocurrency market. All coins from the Top 10 list are in the red zone.
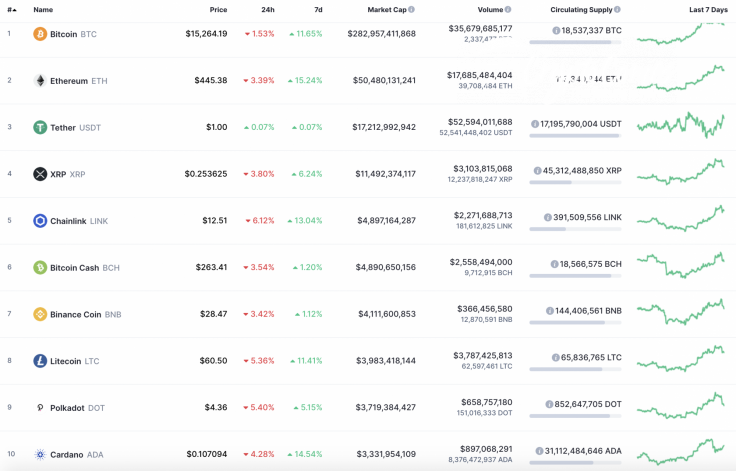
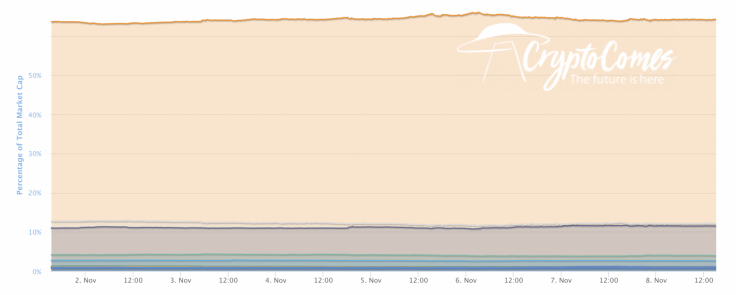
As the rates of the altcoins have gone down more than that of Bitcoin (BTC), the dominance rate of the leading crypto has risen and now makes up 64.2%.
The relevant data of Bitcoin today:
-
Name: Bitcoin
-
Ticker: BTC
-
Market Cap: $282,826,864,367
-
Price: $15,257.15
-
Volume (24h): $35,626,209,205
-
Change (24h): -1.65%
The data is relevant at press time.
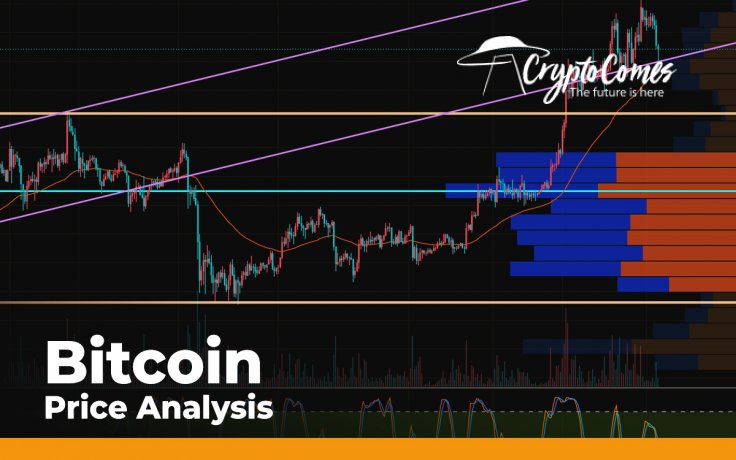
BTC/USD: Can bulls recover the rate of Bitcoin to $16,000?
On the hourly chart, Bitcoin (BTC) has successfully bounced off the support at $14,400. The price blast was supported by a huge trading volume, which means that bulls have the potential to continue the rise.
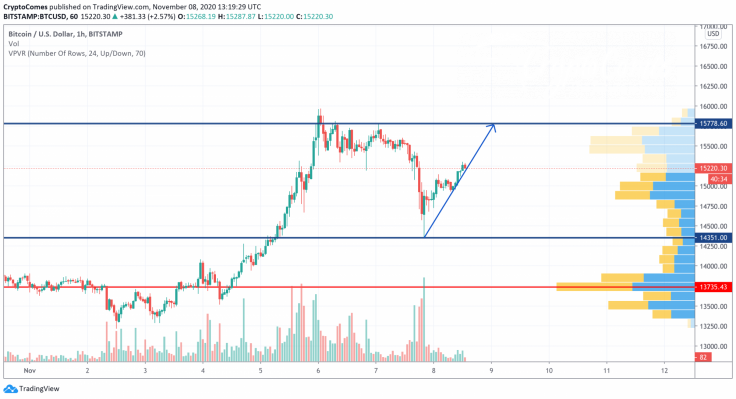
However, the low liquidity is the obstacle on the way to new peaks, which means that buyers' power is not enough to update the previous high of $16,000. In this case, the more likely scenario is growth to the closest resistance at $15,778.
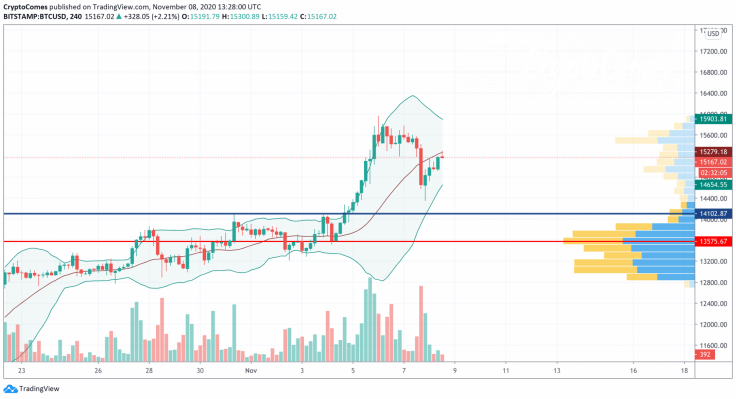
On the bigger time frame, bulls' power is coming to an end, as the price of Bitcoin (BTC) has been growing for a long time without a significant correction.

The resistance line of the Bollinger Bands indicator is going down, which means that buyers have low chances to update the heights without a short-term decline. If that happens, the first stop is around $14,100.
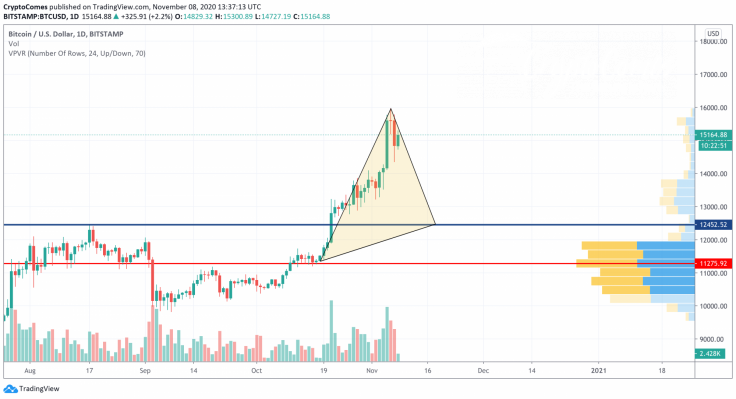
On the daily chart, the main crypto is about to face a more profound drop if bulls want to keep the ongoing rise. The decreasing liquidity and trading volume support such a move. From the technical perspective, the drop may continue to the vital support around $12,500, where bulls might seize the initiative.
Bitcoin is trading at $15,165 at press time.


