If yesterday the cryptocurrency market was just in a slightly bullish mood, today, buyers have increased their power and brought the prices of the coins to new peaks. Mainly, this applies to altcoins as they have shown better performance than Bitcoin (BTC).
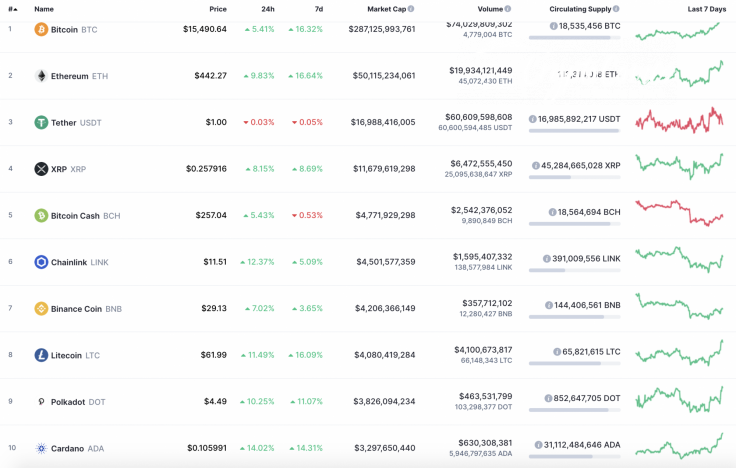
The main statistics on Bitcoin (BTC), Ethereum (ETH) and XRP:
|
Name |
Ticker |
Market Cap |
Price |
Volume (24h) |
Change (24h) |
|
Bitcoin |
BTC |
$287,125,993,761 | $15,490.64 | $74,029,809,302 | 5.41% |
|
Ethereum |
ETH |
$50,115,234,061 | $442.27 | $19,934,121,449 | 9.83% |
|
XRP |
XRP |
$11,679,619,298 | $0.257916 | $6,472,555,450 | 8.15% |
BTC/USD
Yesterday bulls continued their race and easily broke through the upper border of the ascending channel. The strength of the bullish impulse was enough to get close to the $16,000 mark.
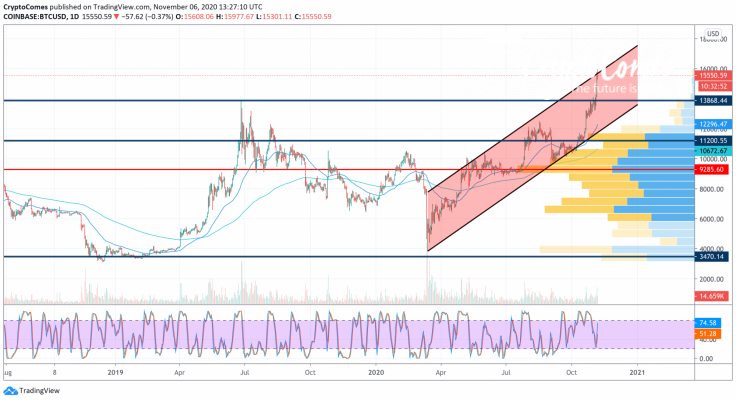
Tonight the annual maximum was set around $15,970 and, in the morning, the price rolled back to the upper border of the rising channel. It looks like the trend line will provide support and the growth will continue to the 78.6% fibo level ($16,125).
Bitcoin is trading at $15,544 at press time.
ETH/USD
Ethereum's (ETH) price yesterday supported the bullish growth of the cryptocurrency flagship and broke through the October high, setting a monthly price record around $442.
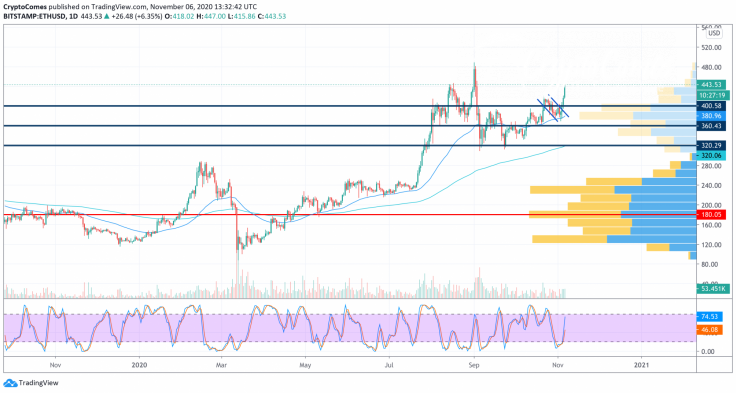
In the morning, the volume of purchases decreased and the pair rolled back to the area of $430. Growth may continue, however, to the blue trend line. In the area of $450-$470, the probability of a reversal is high. If the bulls manage to break through it, they may then open the way to a new annual high.
Ethereum is trading at $443.45 at press time.
XRP/USD
Yesterday the price of XRP showed moderate growth, and it tested the green uptrend line tonight. Buyers have not yet been able to break through it, but if prices continue to rise in the market today, the pair may exit the wide sideways corridor of $0.230-$0.260, where the coin has been for more than two months.
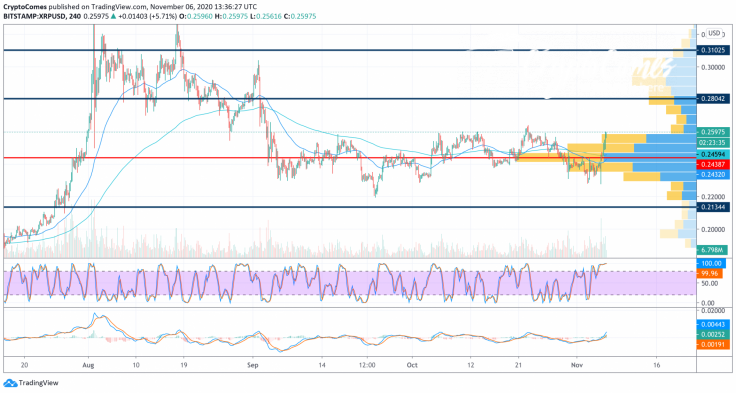
On the other hand, if buyers fail to gain a foothold above the trend line, then movement in a wide sideways range will continue.
XRP is trading at $0.2597 at press time.


