The cryptocurrency market has changed completely since yesterday. Almost all Top 10 coins are showing enormous growth—except for Cardano (ADA), whose rate has declined by 1.21%.
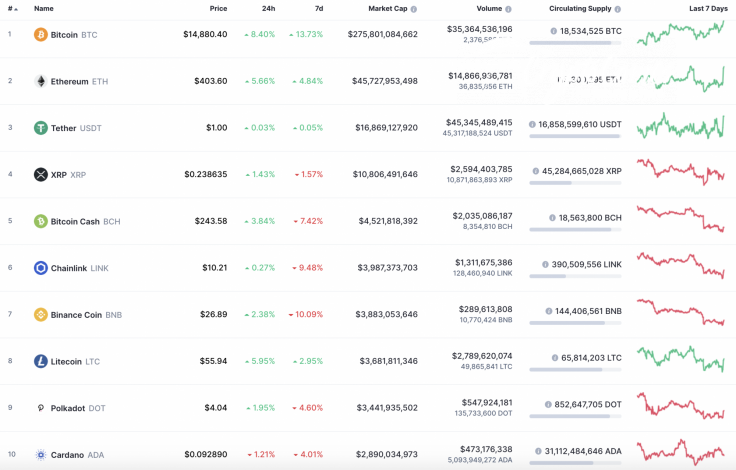
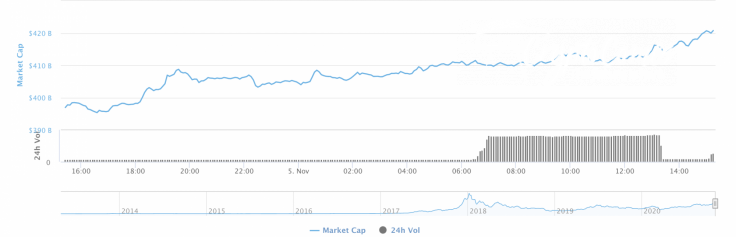
The rise of the market has positively affected the capitalization index, which has rocketed by $20 bln and is now at $420 bln.
The relevant data for Bitcoin is looking the following way:
-
Name: Bitcoin
-
Ticker: BTC
-
Market Cap: $276,296,106,930
-
Price: $14,907.10
-
Volume (24h): $557,571,035,323
-
Change (24h): 8.44%
The data is relevant at press time.
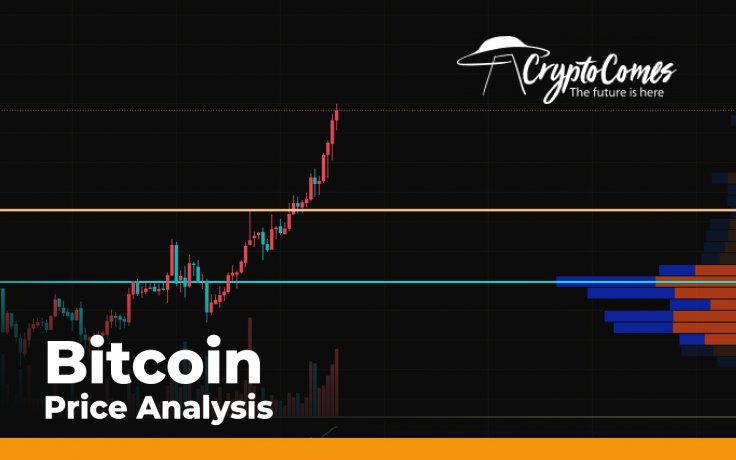
BTC/USD: Can traders expect a correction after $15,000?
Bitcoin (BTC) has shown massive growth over the last time. The rate of the chief crypto has increased by 8.44% over the past 24 hours.
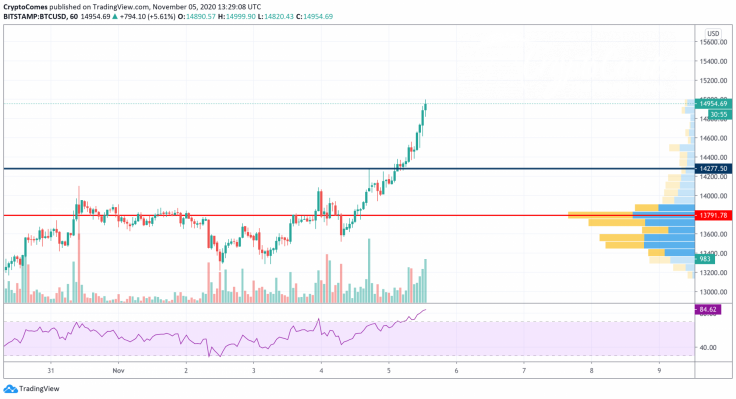
On the hourly time frame, BTC is overbought, as the RSI indicator is already above the 70 mark. In addition, there is not enough liquidity to overcome the next vital resistance of $15,000.

That is why the most likely scenario is a correction to the zone of $14,250-$14,300 before the rise continues.
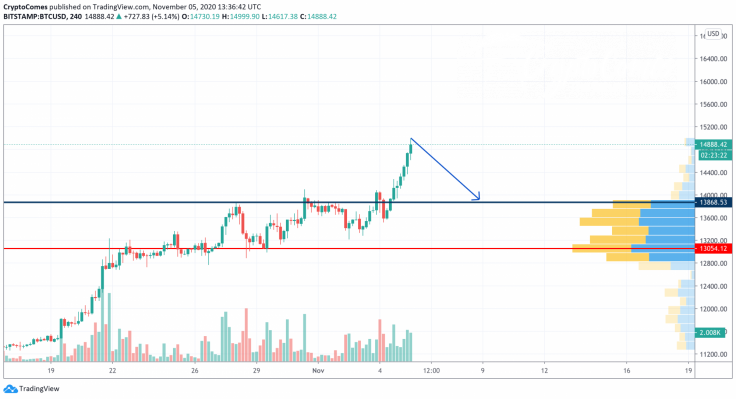
On the longer time frame, the short-term scenario is also much more relevant than fixation above $15,000. However, in this case, the drop may be more profound—to the zone of $13,800. However, such a movement should be considered as part of the correction but not the start of a bearish cycle.
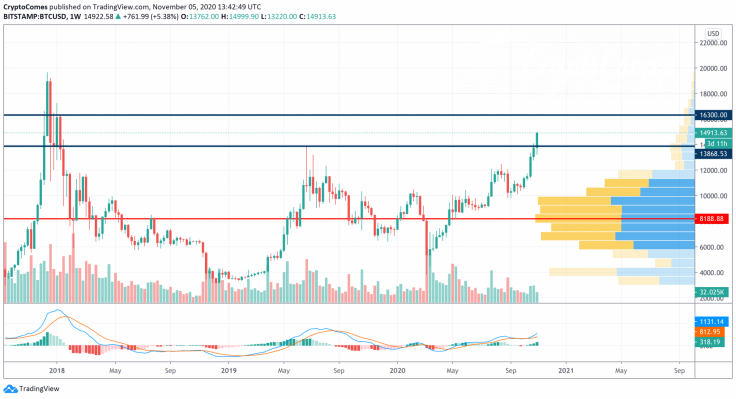
On the weekly chart, Bitcoin (BTC) still has space for growth. The MACD indicator is green, which supports ongoing buyer dominance. From the technical point of view, the next stop at which bears may show resistance is at the level of $16,300. It was reached at the beginning of 2018.
Bitcoin is trading at $14,915 at press time.


