
The situation has become more bearish on the cryptocurrency market as Bitcoin (BTC) and Ethereum (ETH) are the only coins from the Top 10 list located in the green zone.
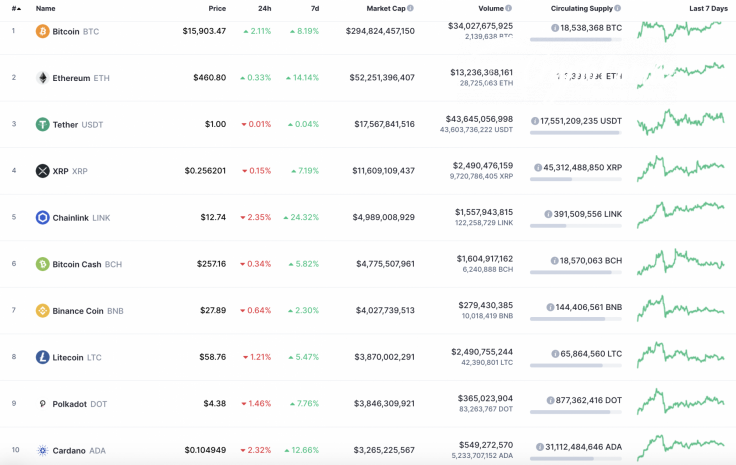
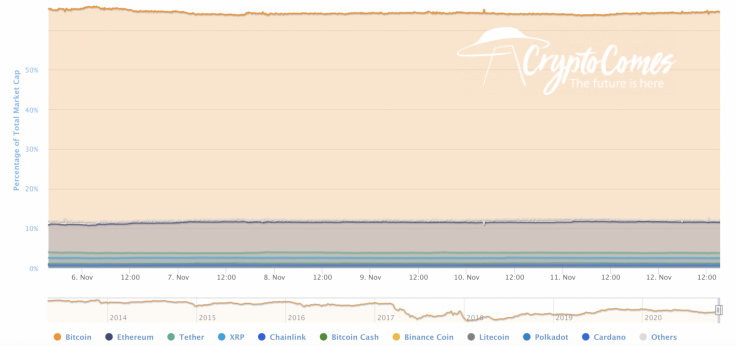
The sharp rise of Bitcoin (BTC) has positively affected its market share, which has increased and now makes up 64.7 percent.
The relevant Bitcoin data for today:
-
Name: Bitcoin
-
Ticker: BTC
-
Market Cap: $294,810,186,648
-
Price: $15,902.70
-
Volume (24h): $33,700,047,182
-
Change (24h): 1.84%
The data is relevant at press time.
BTC/USD: Can bulls break the $16,000 mark and keep the rise?
Yesterday, buyers, at medium volumes, pushed the upper border of the ascending channel and consolidated above the trend line. In the second half of the day, the volume of purchases exceeded the average level and the growth continued to a new annual maximum, in the area of $15,990.
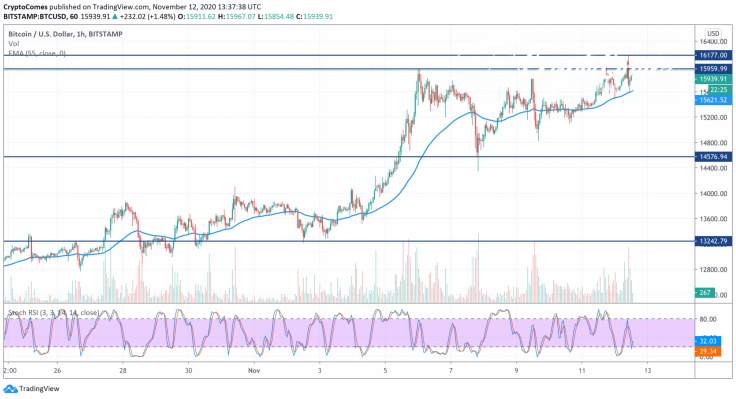
By this morning, the pair was unable to stay in the zone of the annual maximum and rolled back to the trend line, which stopped the decline. If today the upper border of the upward corridor continues to restrain the onslaught of sellers, then the price will renew its annual maximum around $16,200.

If the bears push the uptrend line and roll back the pair below the average price level, then the nearest support, which can stop large sales, may be in the area of the channel's lower border ($14,000).
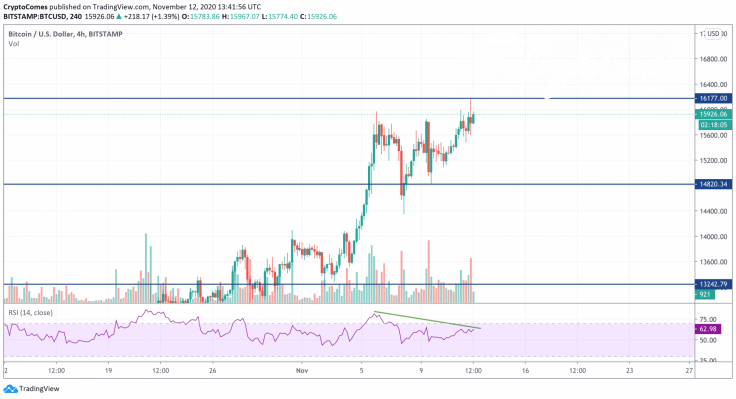
On the 4H chart, Bitcoin (BTC) has formed a bearish divergence which means that a correction might happen soon. In addition, the trading volume is going down. If the leading crypto makes a false breakout of the $16,000 mark, one may expect a correction to around $14,800.
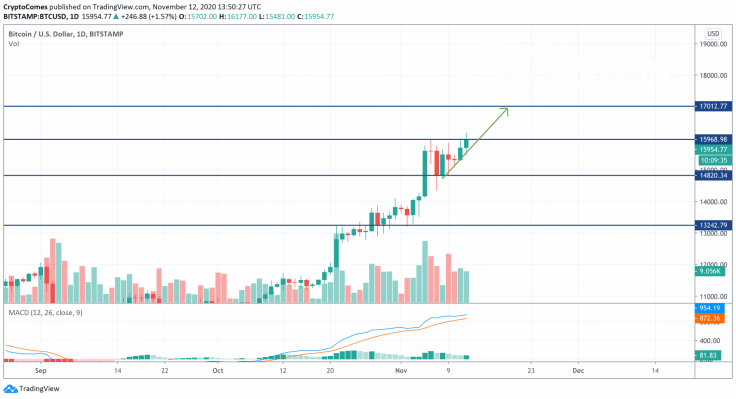
On the daily time frame, the situation is still bullish as the rate of Bitcoin (BTC) is slightly increasing against the rising trading volume. Thus, the lines of the MACD indicator are going up and confirming buyers' dominance. If bulls fix above $16,000, the next target is $17,000.
Bitcoin is trading at $16,031 at press time.


