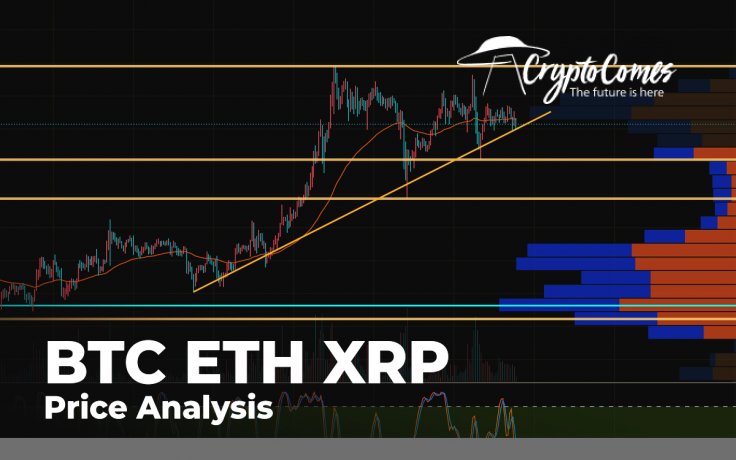
The cryptocurrency market is facing uncertainty now as neither bulls nor bears are dominating at the moment. Some coins from the Top 10 list are in the green zone, while others are in the red.
The main statistics on Bitcoin (BTC), Ethereum (ETH) and XRP:
|
Name |
Ticker |
Market Cap |
Price |
Volume (24h) |
Change (24h) |
|
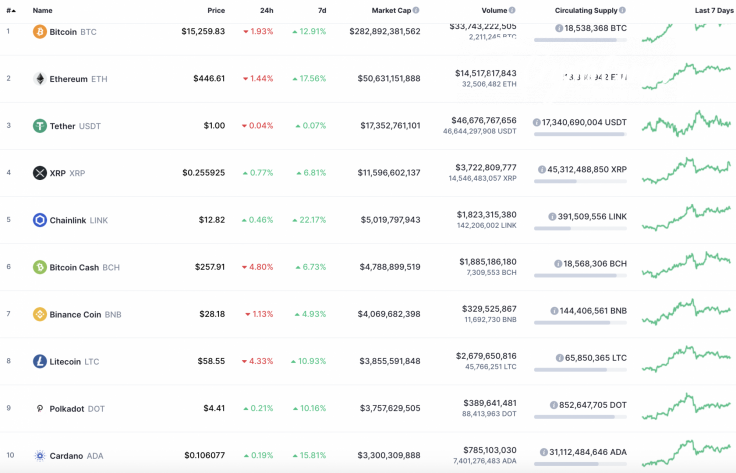
Bitcoin |
BTC |
$282,892,381,562 | $15,259.83 | $33,743,222,505 | -1.93% |
|
Ethereum |
ETH |
$50,631,151,888 | $446.61 | $14,517,817,843 | -1.44% |
|
XRP |
XRP |
$11,596,602,137 | $0.255925 | $3,722,809,777 | 0.77% |
BTC/USD
Yesterday, in the morning, buyers once again tried to break through the upper border of the channel and test the 78.6% Fibo level ($16,125). After the breakout of the upper trend line, growth stopped at the level of $15,800. In the afternoon, bears renewed the pressure and returned the Bitcoin (BTC) price to the upward channel.
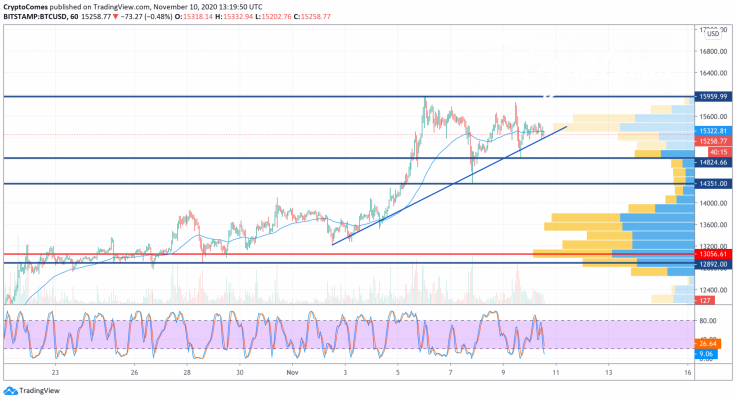
By the end of the day, buyers restored the pair to the upper border of the corridor and, overnight, trading volumes decreased and by morning the pair consolidated in a narrowing range—using the hourly EMA55 as support.
Today, attempts to retest the 78.6% Fibonacci level may be repeated. If bulls form a powerful impulse, they will break this level and renew the annual high around the $16,200 mark.
Bitcoin is trading at $15,230 at press time.
ETH/USD
The price of Ethereum (ETH) yesterday could not continue the struggle for the retest of the trendline, which runs around the $470 mark. The pair spent the whole day in a narrowing range at the level of average prices.
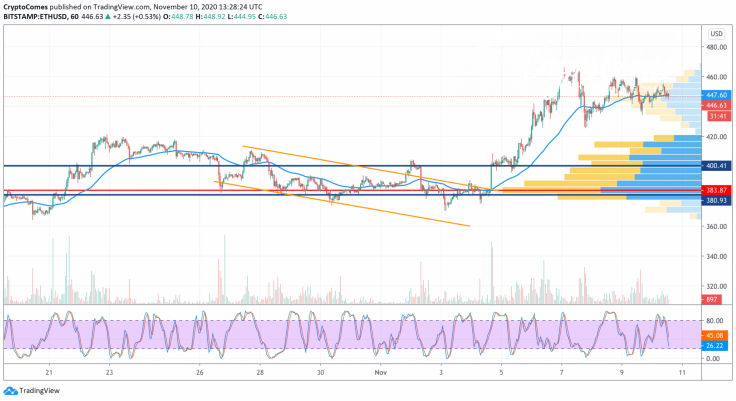
Today, buyers may continue to try to break the trend line and test the resistance of $380. If bears push through the hourly EMA55, the price may roll back to the support of $420.
Ethereum is trading at $445.99 at press time.
XRP/USD
Yesterday, the XRP price failed to gain a foothold above the trend line. After an unsuccessful breakout attempt, the pair rolled back to the support of the POC line ($0.245), which limited the onslaught of sellers.
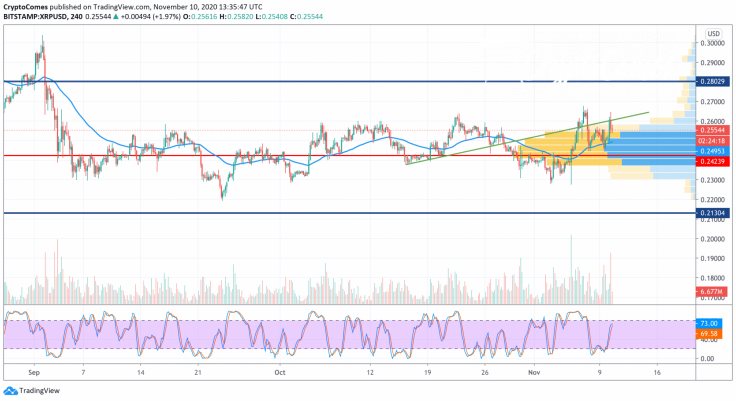
If buyers restore the pair above the trend line today, they will once again try to break through the $0.260 resistance. If the trading volumes are small, the pair will remain within a wide sideways range.
XRP is trading at $0.2553 at press time.


