
Almost nothing crucial has changed on the cryptocurrency market since yesterday. All Top 10 coins remain in the red zone, while Ethereum (ETH) is the main loser among them, falling by 5.57%.
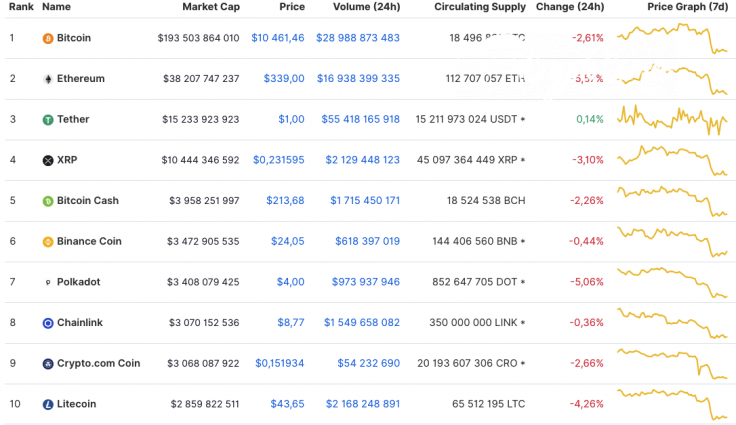
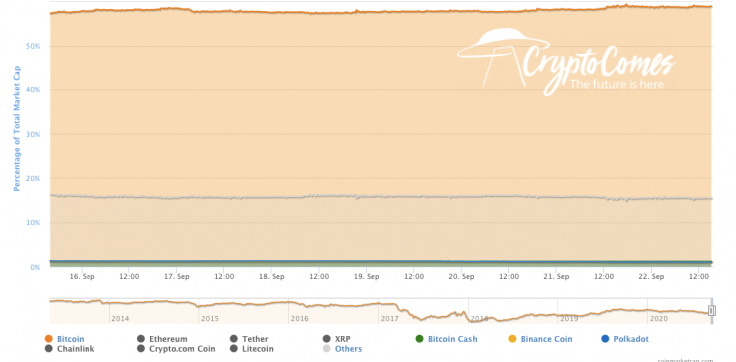
As altcoins are falling faster than Bitcoin (BTC); the market share of the leading crypto has increased and now its index accounts for 58.6%.
The relevant data for Bitcoin is looking the following way today:
-
Name: Bitcoin
-
Ticker: BTC
-
Market Cap: $194,095,833,226
-
Price: $10,493.46
-
Volume (24h): $28,740,684,482
-
Change (24h): -2.01%
The data is relevant at press time.
BTC/USD: Сan bears retest the $10,000 mark by the end of the week?
Yesterday, the bears resumed strong pressure, and the price of Bitcoin (BTC)—breaking through the strong support of $10,500—set a daily low around the level of $10,286.
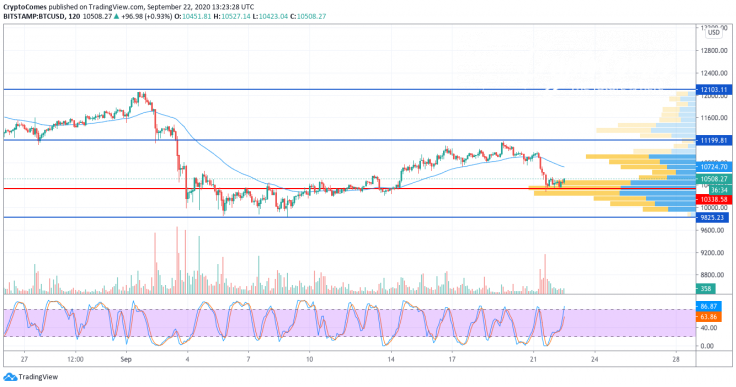
Before the end of the day, buyers tried to restore the price, but buying volumes were quite small and the pair was unable to bounce above the level of $10,500.

For a short time, the Bitcoin (BTC) price might be able to hold in a narrow consolidation around the POC line ($10,277). However, one can soon expect a continuation of the fall below the psychological level of $10,000, to the support area of $9,800.
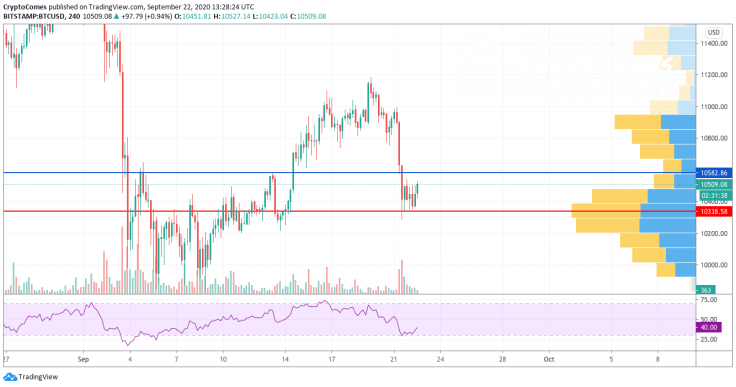
On the 4H time frame, bulls are likely to seize the initiative in the short-term scenario. It is confirmed by bullish divergence on the RSI indicator. However, one should consider it a correction after a fall but not a trend change. In this case, the endpoint of the rise may be the $10,582 mark.
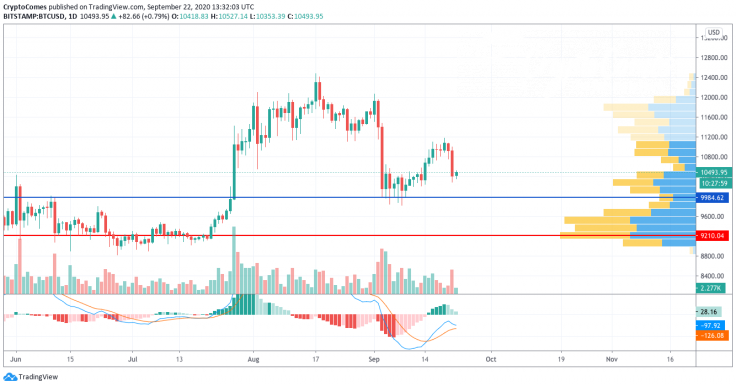
On the bigger chart, the drop might not have finished yet, and bears are about to push the rate of Bitcoin (BTC) deeper to the liquidity level around $10,000. Moreover, the blue line of the MACD indicator is likely to cross the red one that suggests an ongoing drop. That is why there is a high chance of the chief crypto reaching $10,000 by the end of the current month.
Bitcoin is trading at $10,494 at press time.


