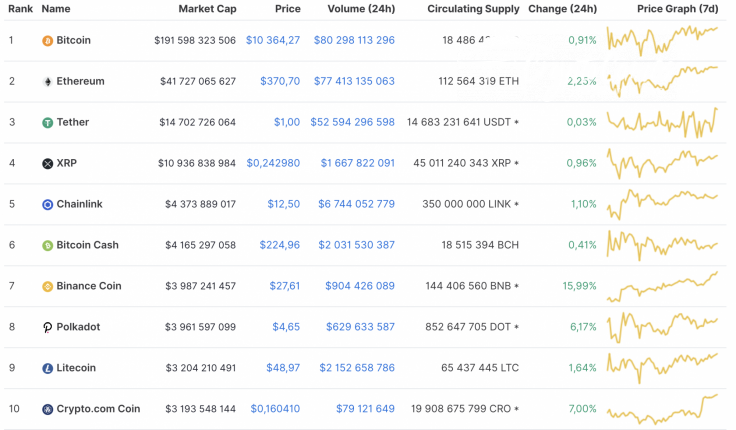
The weekend got started with a positive mood on the cryptocurrency market. All Top 10 coins are in the green zone, while the top gainer is Binance Coin (BNB)—whose rate has rocketed by 16% since yesterday.
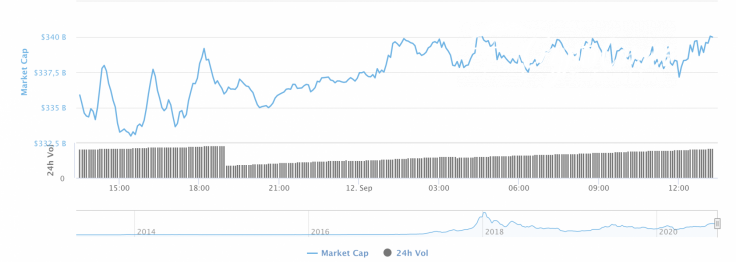
The rise of most of the coins has influenced total market capitalization, which increased by $5 bln and is now at $340 bln.
The relevant data for Binance Coin today:
-
Name: Binance Coin
-
Ticker: BNB
-
Market Cap: $3,956,001,583
-
Price: $27.39
-
Volume (24h): $928,867,016
-
Change (24h): 15.09%
The data is relevant at press time.
BNB/USD: Сan bulls bring the rate to $30 before a fall?
Binance Coin (BNB) has gotten out of the correction phase faster than the other coins. The price of the native exchange token has risen by 15%, while the price change over the last week has accounted for 33%.
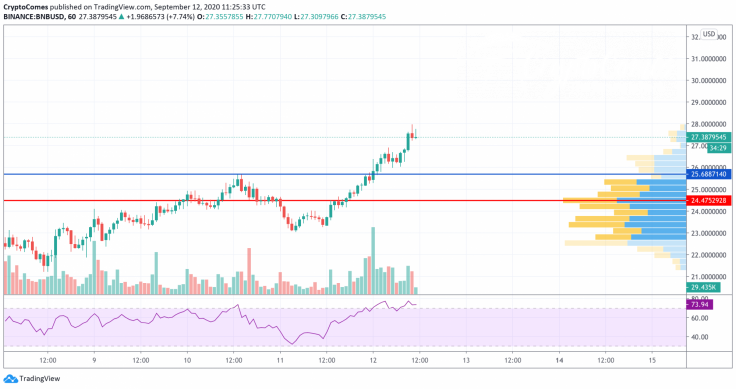
On the hourly chart, Binance Coin (BNB) is already located in the overbought zone despite a long-term bullish trend. It is confirmed by the value of the RSI indicator, which has surpassed 70.

What's more, there is no liquidity above, which means that there are fewer buyers who want to buy the altcoin at the current price. In this case, a drop to $25 is likely.
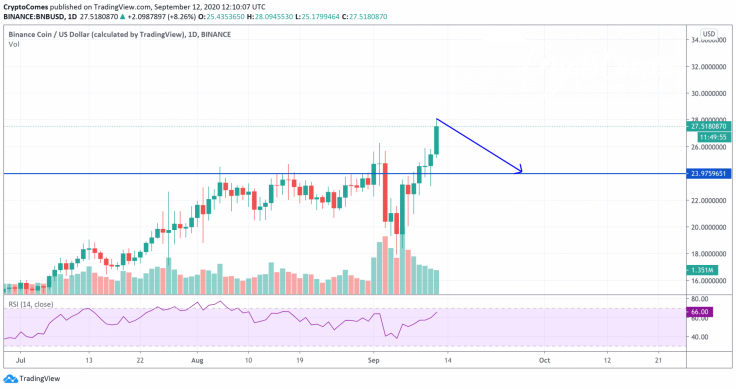
On the daily time frame, a short-term decline is the most likely price action. Since the beginning of the month, the trading volume has been steadily decreasing, suggesting a correction might occur soon. If bulls do not seize the initiative, the decline may stop at around $24.
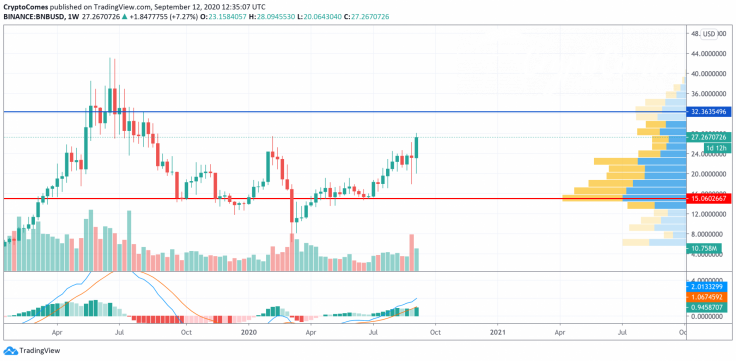
On the weekly chart, Binance Coin (BNB) has just emerged from a long consolidation phase and confirmed the long-term bullish trend. The lines of the MACD indicator are going upward, which suggests the presence of buyers. For this reason, the target of $32 may be achieved by the end of the year.
Binance Coin is trading at $26.78 at press time.


