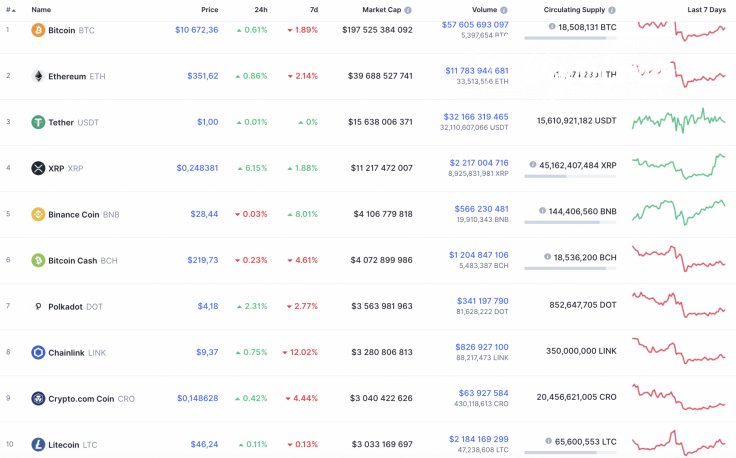
The new week has started with a relatively positive mood on the cryptocurrency market. Almost all coins from the Top 10 list are green, except for Binance Coin (BNB) and Bitcoin Cash (BCH), whose rates have gone down by 0.03% and 0.23%, respectively.
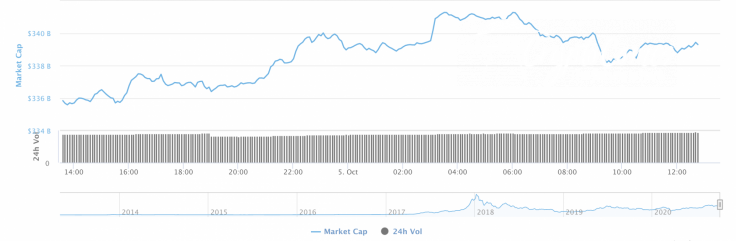
The total market capitalization has also gone up as a result of the price rise of digital assets. In this case, the index has increased by $5 bln and is now at $340 bln.
The relevant data for XRP today:
-
Name: XRP
-
Ticker: XRP
-
Market Cap: $11,264,071,455
-
Price: $0.249413
-
Volume (24h): $2,222,886,869
-
Change (24h): 6.45%
The data is relevant at press time.
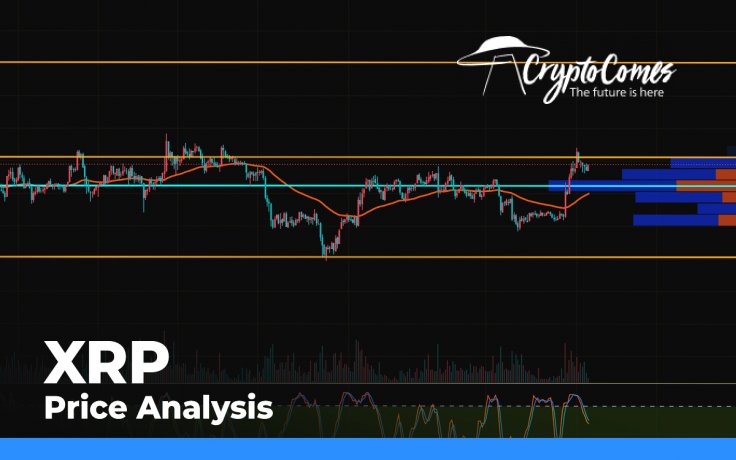
XRP/USD: Can bulls fix above $0.25 at the current growth?
Last Saturday, the XRP price consolidated for a long time above the support level of $0.230 and, on Sunday, buyers increased in volume and the pair showed dynamic growth.
Tonight, the pair broke through the $0.250 resistance and set a local maximum around the $0.253 mark. If the bulls manage to continue the rise, then, at the beginning of this week, the Ripple price may test the resistance of $0.280.
However, yesterday's raid of buyers above the $0.250 resistance significantly warmed up the market, and now the Stoch RSI indicator lines have entered the overbought zone. The potential for continued growth remains, but if the bears resume pressure, the pair will again drop to the level of the two-hour EMA55.
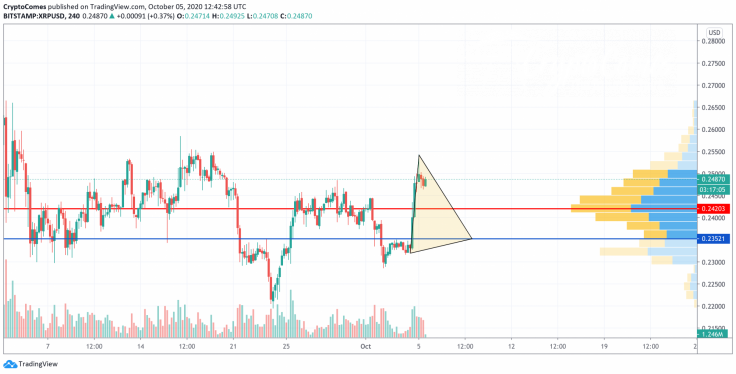
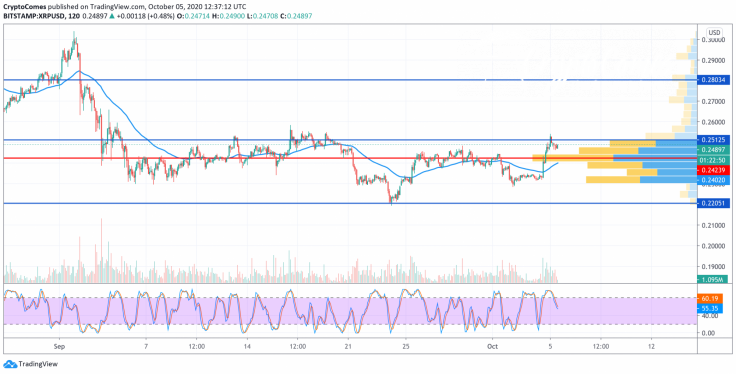
On the 4H time frame, XRP has made a false breakout of the $0.25 mark. Analyzing the chart, the rise has just started as XRP has accumulated enough power for growth. However, there is great potential to see a retest of the support channel at $0.2352. The current scenario is a part of the correction but not the start of a bearish trend.
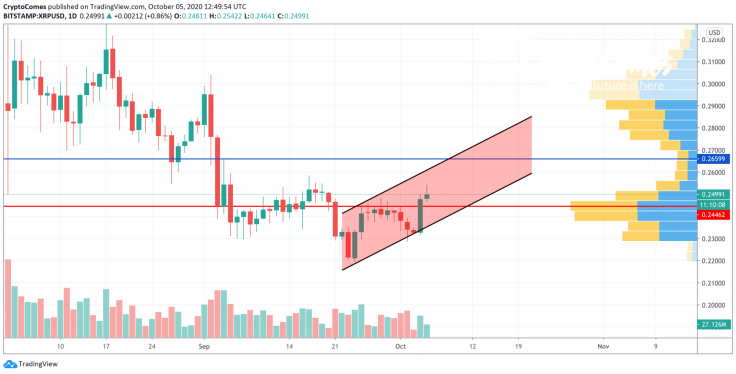
On the daily chart, the last candle confirmed the bullish trend. The buying trading volume is slightly increasing, which is a good signal for bulls. If the situation remains the same and liquidity rises, resistance at $0.2659 may be attained by mid-October.
XRP is trading at $0.2521 at press time.


