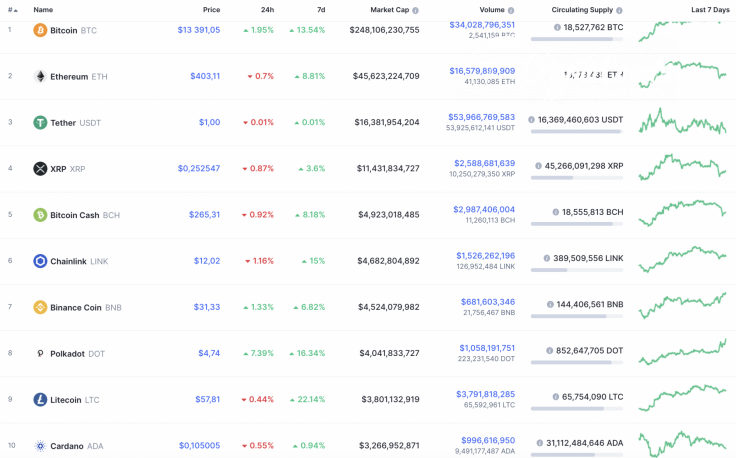
The cryptocurrency market is not trading in one direction as some coins keep rising while others have already entered the correction phase. Most of the cryptocurrencies are in the red zone; however, there are exceptions to the rule, such as Polkadot. The altcoin has grown by 7.39% since yesterday.
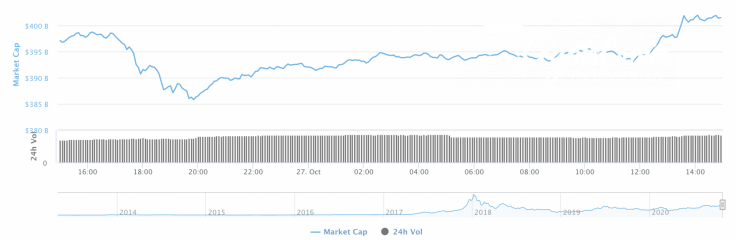
Despite the uncertainty on the market, the capitalization index has risen by around $5 bln over the last day.
The relevant data of XRP for today:
-
Name: XRP
-
Ticker: XRP
-
Market Cap: $11,450,207,259
-
Price: $0.252953
-
Volume (24h): $2,590,381,479
-
Change (24h): -0.61%
The data is relevant at press time.
XRP/USD: Can the $0.26 mark be retested soon?
Yesterday morning, the bulls were unable to form a powerful impetus due to the overheating of the market. By the middle of the day, the pair rolled back below the EMA55 level and, in the evening, the pullback stopped at the POC line ($0.242).
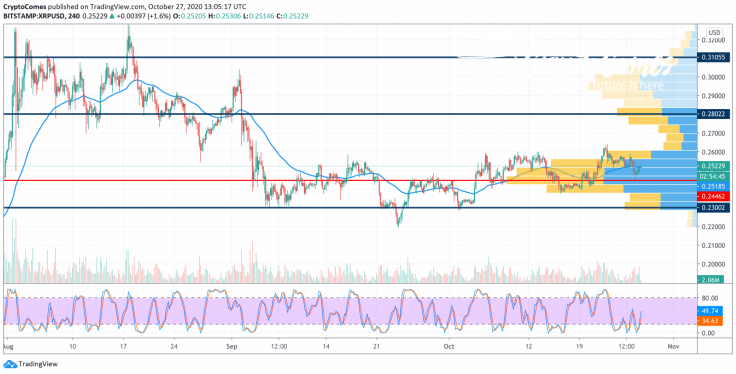
The Stoch RSI indicator lines left the overbought zone and entered the neutral zone. If buyers do not take active steps to restore the pair to the upper border of the wide sideways range ($0.260), then the decline will continue to support $0.230.
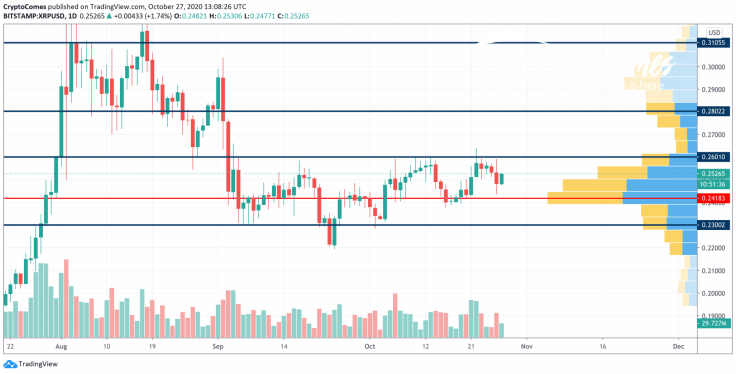
On the daily chart, XRP keeps trading in the range of $0.24-$0.26, accumulating for a sharp move. Buyers' power has not ended yet, which means that a rise is more likely than a drop.
In this regard, traders may retest the resistance at $0.26 within the next few days; however, a further rise is in question as the liquidity is quite low.

On the longer time frame, XRP is located in the sideways trend at the moment. The trading volume is at a medium level, meaning that neither bears nor bulls are dominating. However, in the long-term perspective, there is a high chance of seeing a false breakout of the $0.285 zone before a more profound correction starts.
XRP is trading at $0.2524 at press time.


