Saturday has begun with the continued growth of the cryptocurrency market. However, if yesterday all Top 10 coins were in the green zone, today, Bitcoin (BTC) is the only loser from the list. The rate of the chief crypto has fallen by 0.43%.
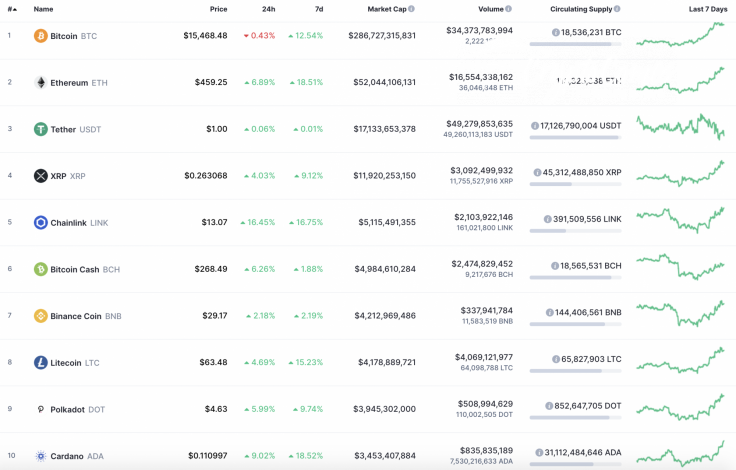
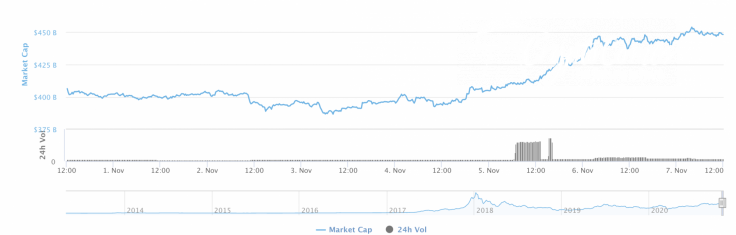
Meanwhile, total market capitalization has increased by $40 bln and now makes up $448 bln.
The relevant data of XRP for today:
-
Name: XRP
-
Ticker: XRP
-
Market Cap: $11,903,589,590
-
Price: $0.262700
-
Volume (24h): $3,086,537,718
-
Change (24h): 4.24%
The data is relevant at press time.
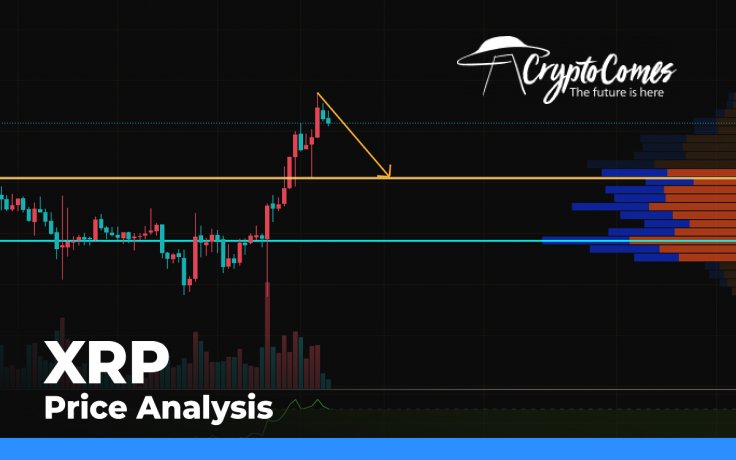
XRP/USD: Is the power enough to get to $0.30?
XRP has shown significant growth recently. The rate of the altcoin has risen by 4.24% since yesterday, while the price change over the last week has accounted for 8.92%.
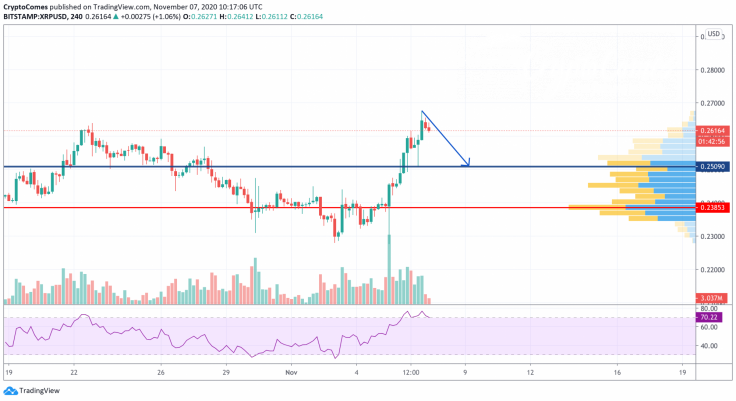
On the 4H chart, correction signals have appeared that are confirmed by low liquidity and a decreasing trading volume. Thus, there is a bearish divergence on the RSI indicator, which means that sellers are likely to seize the initiative in the short term. In this case, traders may expect XRP trading around the support zone at $0.25 soon.
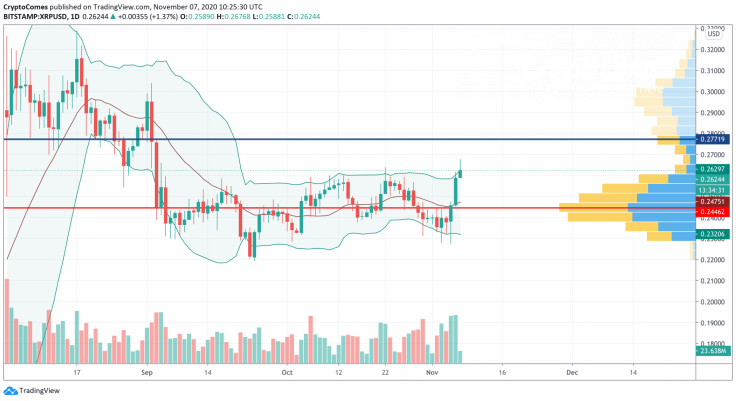
On the bigger time frame, the growth potential of XRP has not finished yet, and bulls may get the rate of the altcoin to the closest support at $0.2771 soon. In addition, the support and resistance lines of the Bollinger Bands indicator are moving up.
However, it is unlikely to break this level for the first time, as buyers' power is not strong enough to support an ongoing rise.
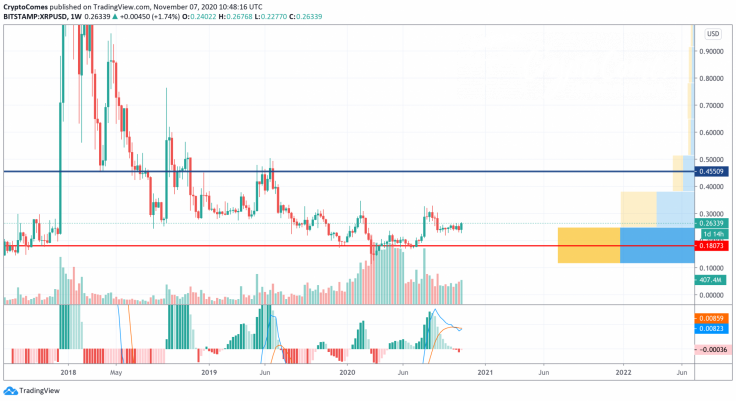
According to the weekly chart, the long-term growth has just begun. The trading volume keeps going up slightly, which confirms buyers' potential. Furthermore, the blue line of the MACD indicator is about to cross the red zone and confirm the bullish trend. If that happens, XRP has a chance to get to $0.4550 by the end of the year.
XRP is trading at $0.2630 at press time.


