The week is nearing its end under bulls' influence even though not all coins from the Top 10 list are in the green zone today. The rates of Bitcoin (BTC) and Litecoin (LTC) have declined since yesterday.
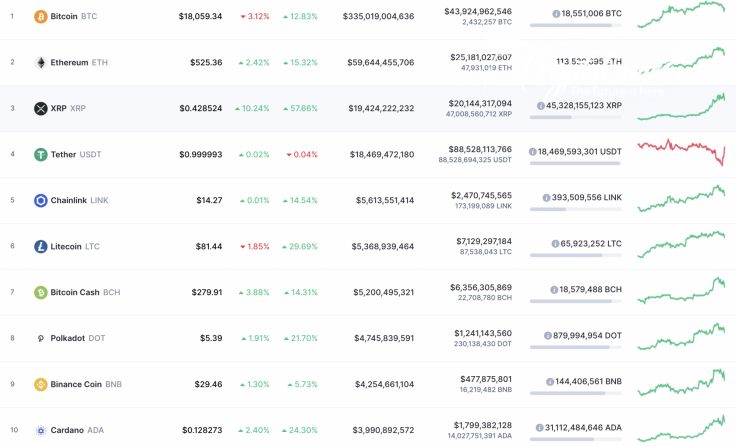
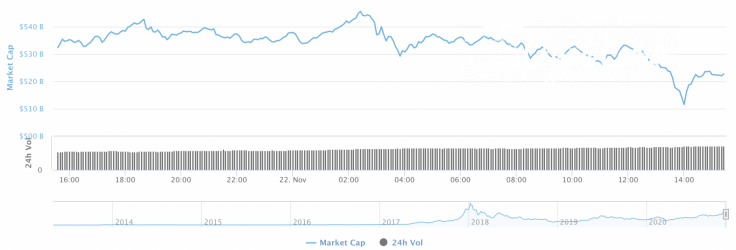
Although most of the coins are green today, the total market capitalization has gone down by $10 bln and now makes up $522 bln.
The relevant data of XRP is looking the following way today:
-
Name: XRP
-
Ticker: XRP
-
Market Cap: $19,758,174,013
-
Price: $0.435892
-
Volume (24h): $20,238,313,984
-
Change (24h): -2.93%
The data is relevant at press time.
XRP/USD: How much more effort do bulls need to reach $0.50?
XRP is the main gainer among the top coins over the last week. The coin has replaced USDT in the global cryptocurrency ranking and is now located in third place. The total growth has accounted for 60%.
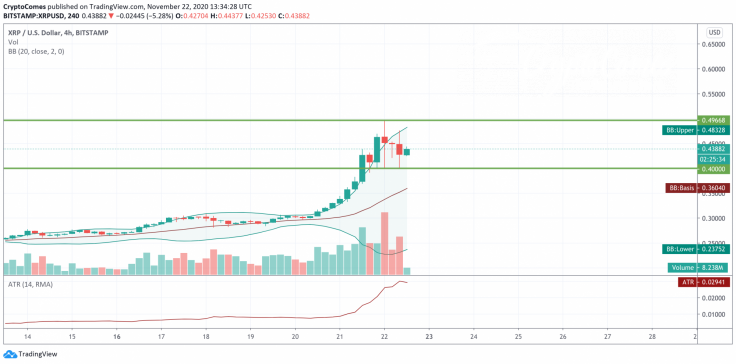
On the 4H chart, the correction has already occurred. At the moment, XRP is trading within the range of $0.40-$0.49. From the technical perspective, a drop is unlikely to happen as the selling trading volume is decreasing.
In terms of a further rise, it is too soon to consider it, as buyers need to accumulate more power for that. In this case, sideways trading is the more preferable scenario for the near future.
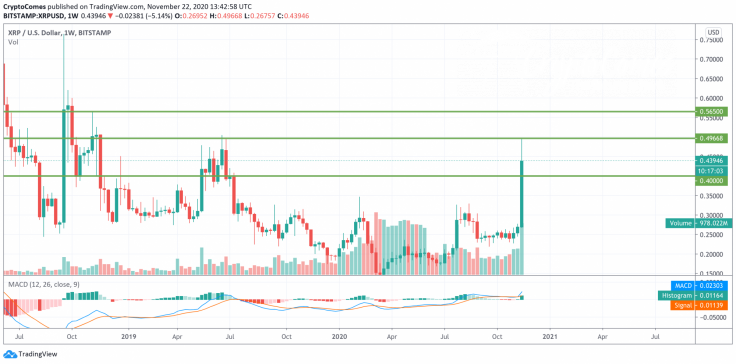
On the weekly time frame, the growth has just begun and bulls have confirmed the long-term bullish trend. Moreover, the lines of the MACD indicator have switched to green, also supporting a further rise. Thus, the growth is supported by the trading volume, which means that the next resistance at $0.565 may be achieved by the end of the year.
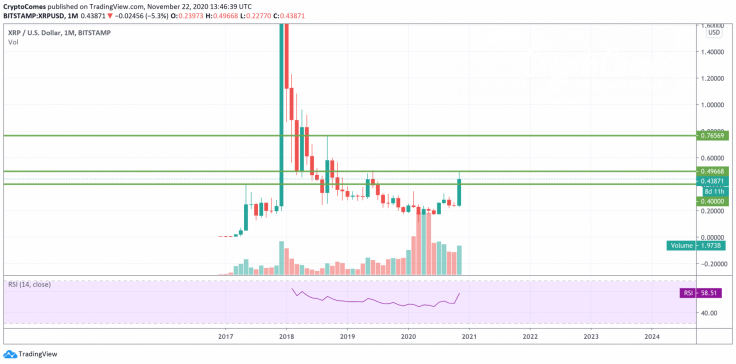
On the bigger chart, the long-term bearish period has finished and bulls may have seized the initiative. Such a statement is supported by the bullish divergence on the RSI indicator, according to which XRP may reach $0.7656 within the next few months.
XRP is trading at $0.4374 at press time.


