Back

XRP Price Analysis for January 6

Is the $38,000 mark the last target before a deep correction of Bitcoin (BTC)?

article image
Cover image via www.tradingview.com

Disclaimer: The opinion expressed here is not investment advice – it is provided for informational purposes only. It does not necessarily reflect the opinion of CryptoComes. Every investment and all trading involves risk, so you should always perform your own research prior to making decisions. We do not recommend investing money you cannot afford to lose.

The bullish mood remains on the cryptocurrency market as almost all coins from the top 10 list are in the green zone. XRP is the only exception to the rule, declining by 1.40%.

Top 10 coins by CoinMarketCap

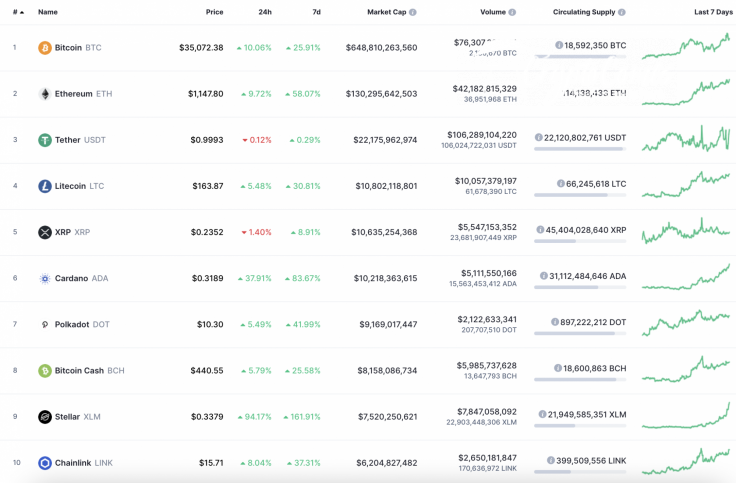
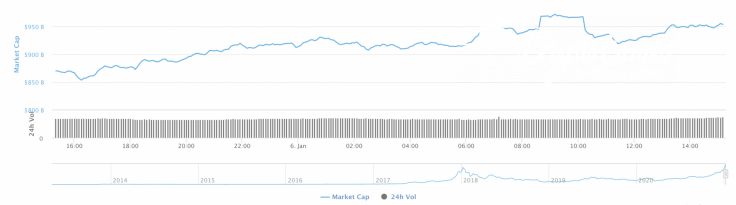
Market capitalization keeps booming and has increased by $84 billion over the last day, now making up $954 billion.

Cryptocurrency market capitalization

The relevant data for Bitcoin today:

  • Name: Bitcoin

  • Ticker: BTC

  • Market Cap: $647,057,384,446

  • Price: $34,629.77

  • Volume (24h): $71,496,479,341

  • Change (24h): 8.55%

The data is relevant at press time.

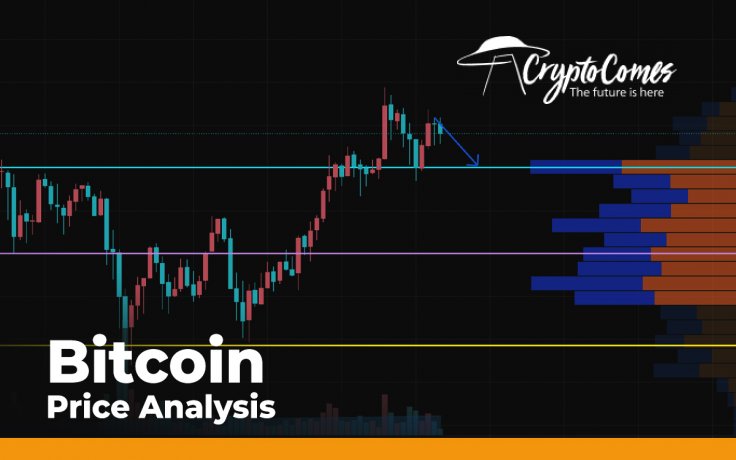
BTC/USD: Can one expect a correction before a move to $38,000?

Bitcoin (BTC) keeps setting new highs. The rate of the chief crypto has surpassed the $35,000 mark. The growth since yesterday has made up 8.54%.

BTC/USD chart by TradingView

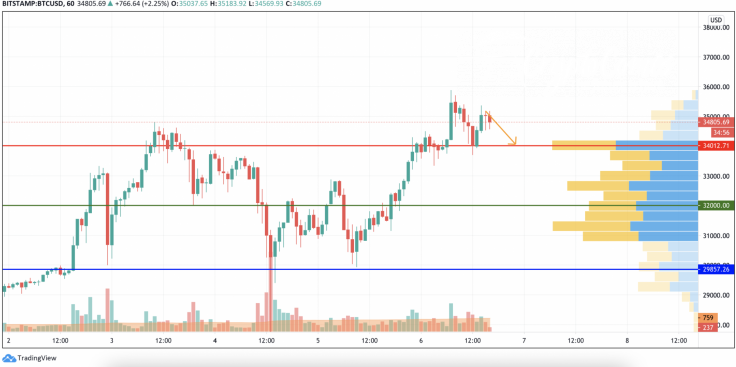
On the hourly chart, one might expect a short-term decline to the liquidity zone around $34,000. Such a move is confirmed by the low trading volume.

👉 MUST READ XRP Price Analysis for January 5related article image

However, it is not the start of the long-term decline but just a correction before further growth.

BTC/USD chart by TradingView

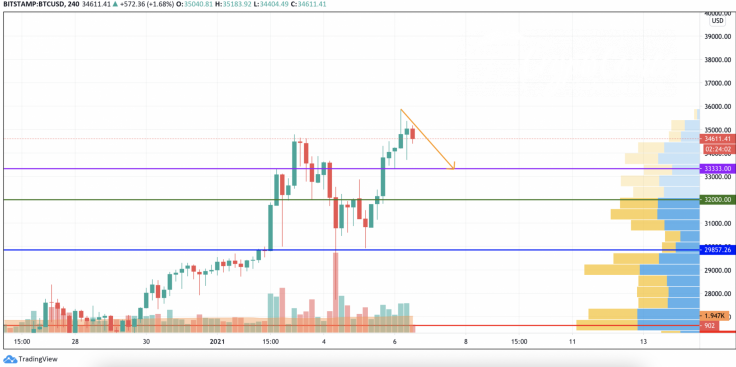
On the longer time frame, the situation is similar; however, the drop may be more profound: up to $33,300 if bulls do not fix above $35,000 from the first attempt. Such a scenario is relevant until the end of the week.

BTC/USD chart by TradingView

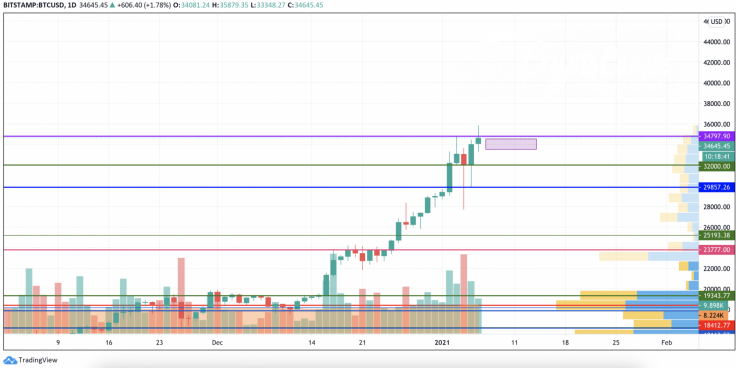
From the long-term perspective, Bitcoin (BTC) needs to accumulate power to keep rising higher. In this case, the more likely price action is trading sideways in the range of $33,500-$34,500.

Bitcoin is trading at $34,675 at press time.


In this Telegram channel you’ll find fresh news, interviews, infographics, forecasts & other helpful stuff. Join CryptoComes's channel.

article writer image
Denys Serhiichuk

With more than 5 years of trading, Denys has a deep knowledge of both technical and fundamental market analysis. Mainly, he has started his blog on TradingView where publishes all relevant information and makes predictions about top coins.
Thus, his experience is backed up by working in top blockchain related companies such as W12, Platinum Listing & ICO Advisory, ATB Coin, and others, can be contacted at [email protected]