The last day of the week started on a relatively positive note for the market as all of the Top 10 coins are in the green zone. The biggest winner is Binance Coin (BNB), which has skyrocketed up by 7.61% since yesterday.
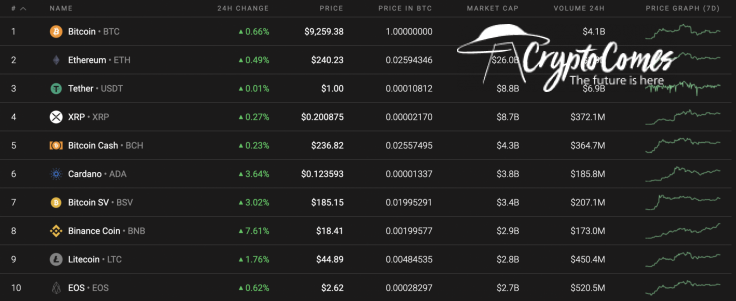
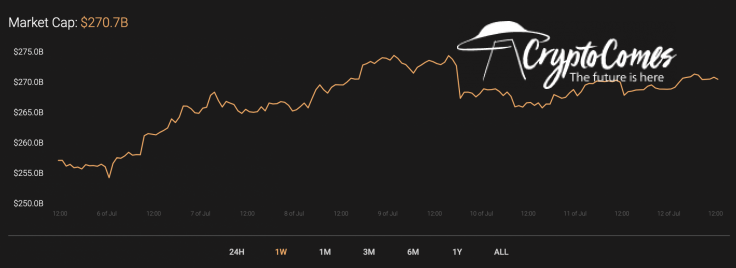
Over the course of the week, the cryptocurrency's market capitalization has added around $13B and is currently valued at $270.7B.
Below is the relevant data for XRP and how it's looking today:
-
Name: XRP
-
Ticker: XRP
-
Market Cap: $8,909,801,470
-
Price: $0.201316
-
Volume (24H): $831,771,500
-
Change (24H): 0.83%
XRP/USD: How Long Can Bulls Maintain the Rate Above $0.20?
Over the course of the week, XRP has performed better in terms of price as compared Bitcoin (BTC) and Ethereum (ETH). The rate for the altcoin has increased by 14%.
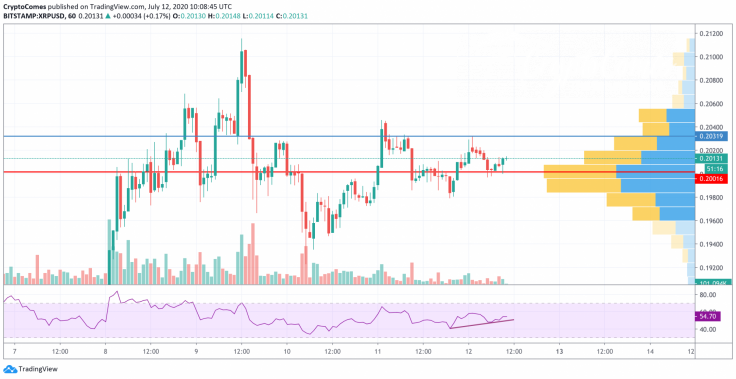
Looking at the hourly chart, XRP is trading in between the $0.20 and $0.2040 range. At the moment, it is about to reach the $0.2040 resistance mark as buyers are becoming more active. Thus, there is a bullish divergence on the Relative Strength Index (RSI). The trading volume is also located at the relatively medium level. This is why traders might expect to see XRP at $0.2040 by the beginning of next week.
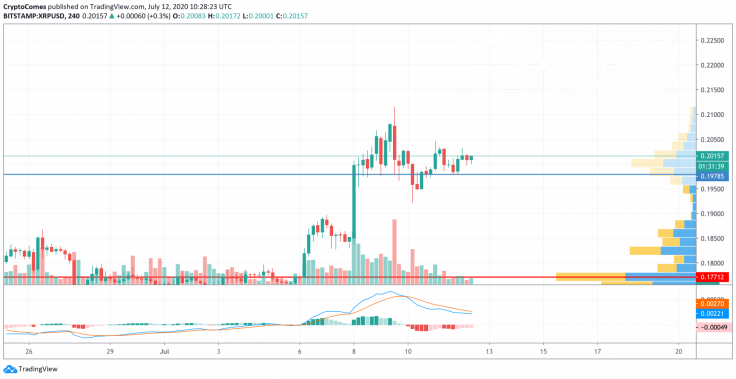
Looking the 4H time frame, the bulls have not accumulated enough strength for a continued rise. The trading volume continues declining, which is not good for buyers. Moreover, the lines of the Moving Average Convergence/Divergence (MACD) are going down, which means that the decline might continue. In this particular case, the nearest support level is located at $0.1978, which may be attained next week.
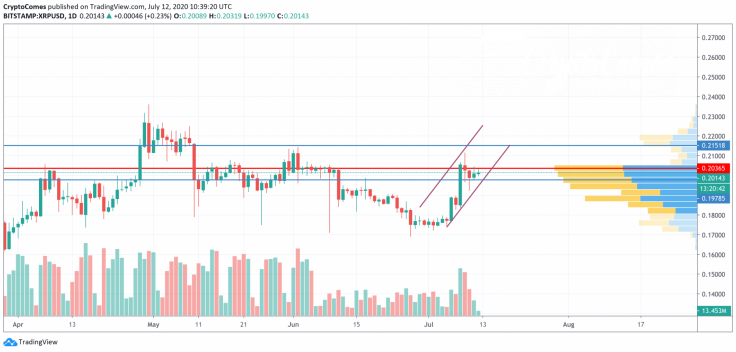
Looking at the bigger chart, XRP continues to receive support for resuming the rise; however, it is unlikely to happen as the trading volume remains relatively the same. The more likely scenario is that the growth will probably last until the coin reaches the $0.2151 mark. Besides, XRP's liquidity is low to continue the bullish wave.
At press time, XRP was trading at $0.2018.


