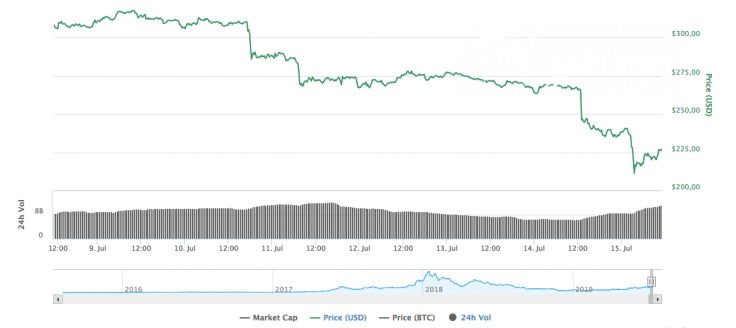
Against the background of the falling cryptocurrency market, Ethereum is showing around a 17% decline over the last 24 hours. Currently, it looks like the biggest ‘loser’ compared to Bitcoin and Ripple.
However, it doesn’t mean that traders are switching from Ethereum to other coins, as the trading volume has almost doubled over the last day.

Now, let’s get to the chart for understanding the nearest price movements of the leading altcoin.

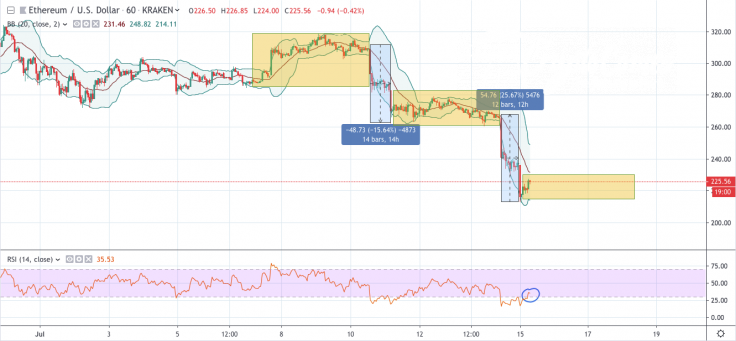
On the 1H chart, the rate of Ethereum has already faced two waves of correction since the beginning of July, when each time the price plummeted by more than 10%. Applying the current situation to the graph, we can expect a sideways movement in the range between $215 and $230 in a few days.
Ethereum should not drop below the psychological $200 mark due to the RSI indicator which is located near the oversold area.

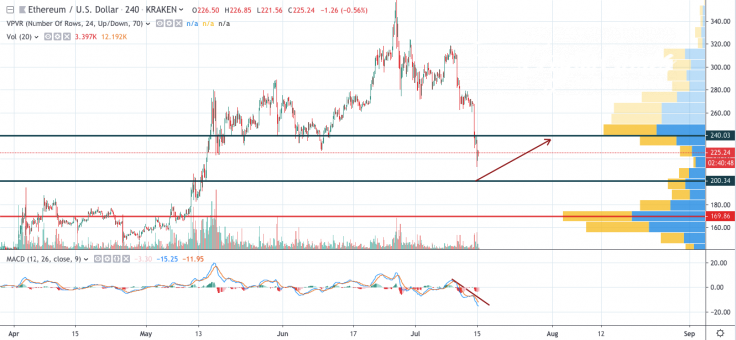
On the bigger time frame, ETH is looking more bearish, taking into account the falling MACD indicator. In this regard, if bears break the support at $200, we are likely to expect a bounce back to around $240 in August. The increasing index of trading volume confirms such a scenario.
At the time of writing Ethereum price is trading at the level near $225.28.


