Cryptocurrencies continue to correct near important support levels. A breakdown of these areas downward may indicate an even deeper correction of the entire market. However, if buyers can show some strength and prices can push higher, the chances of continued gains will be much higher.

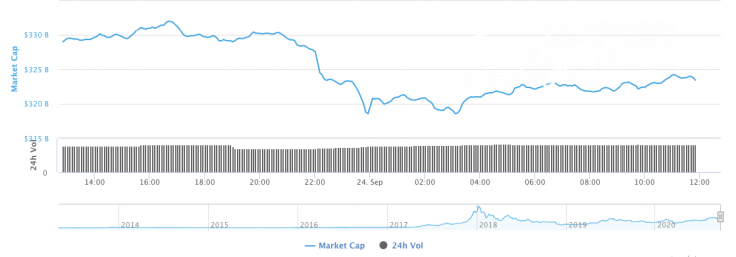
A slight dominance of bears over bulls has also affected the total market capitalization that has lost $5 bln and now constitutes $325 bln.
The relevant data for Ethereum for today:
-
Name: Ethereum
-
Ticker: ETH
-
Market Cap: $36,941,702,766
-
Price: $327.71
-
Volume (24h): $14,576,660,830
-
Change (24h): -2.65%
The data is relevant at press time.
ETH/USD: Can a retest of $350 occur before the decline continues?
Sellers resumed pressure yesterday and the Ethereum (ETH) price pierced the support of $320. Sales did not exceed Monday's volume, so the bears did not manage to update the monthly minimum, which was set on Sept. 5 at the level of $309.
The pair's decline stopped at the point of $313 and bounced overnight to the level of $320. If buyers manage to continue the rise this morning, they might test the two-hour EMA55.

The pair has a low chance of breaking above the level of average prices and, at the end of the week, the decline will continue to the psychological level of $300.
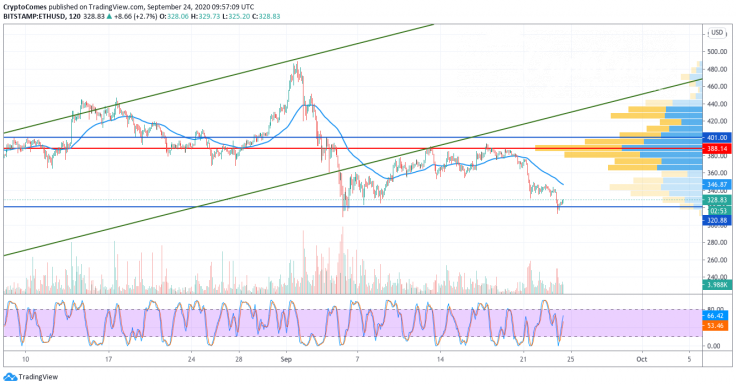
On the shorter time frame, the price is declining, but the current structure of the movement can be considered a "double bottom" reversal pattern. Therefore, with the breakdown of the level of $397, one can expect a steady rise to the level of
$490 as part of the development of this pattern. An additional signal in favor of this option is the fall of the RSI indicator below the level of 30; earlier, similar movements preceded the completion of the decline.
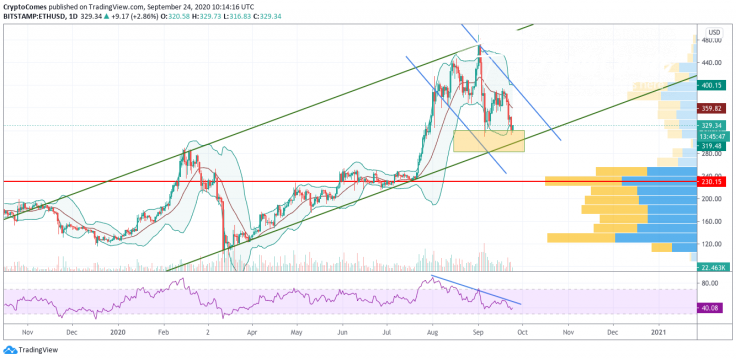
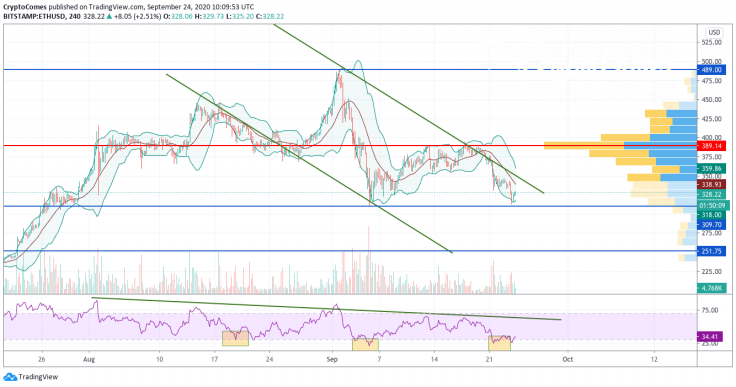
ETH/USD quotes on the daily chart continue to correct within the ascending channel. The current structure of the price movement is a bullish 5-0 pattern, similar to the one on the BTC/USD chart. Only here the price came close to the lower border of the model, and on the Bitcoin chart, there is still a lot of room for quotes to fall to the $7,000 level. Therefore, one should not exclude a test of the $306 level and the beginning of the upward movement of Ethereum (ETH). A good signal in favor of this option will be a breakdown of the downward trend line on the RSI indicator.
Ethereum is trading at $329.08 at press time.


