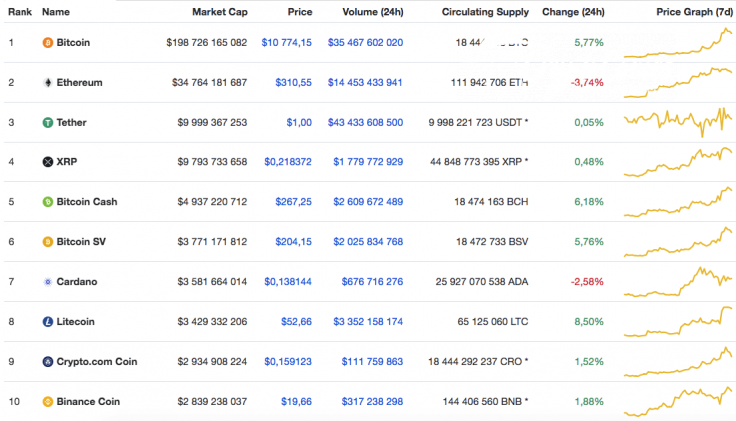
Bitcoin (BTC) is taking the lead among cryptocurrencies; however, most of the coins from the top 10 list are located in the green zone. Ethereum (ETH) and Cardano (ADA) are the only losers, as their rates have gone down by 3.74% and 2.58%, respectively.
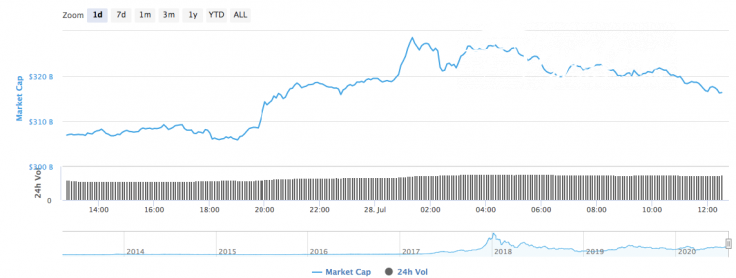
The rise of Bitcoin (BTC) and some other coins have affected total market capitalization, which has increased by around $10 bln and now makes up $316 bln.
The key data for Ethereum is looking the following way:
-
Name: Ethereum
-
Ticker: ETH
-
Market Cap: $34,774,092,939
-
Price: $310.64
-
Volume (24h): $14,529,061,136
-
Change (24h): -3.83%
The data is current at press time.
ETH/USD: Can the leading altcoin repeat the growth of Bitcoin?
Yesterday morning the bulls could not continue to rise above the resistance of $330, and during the day the pair consolidated sideways. Late at night, weak bullish momentum—which was not supported by large volumes—pierced the $330 level, renewing the annual high around the $334 mark.
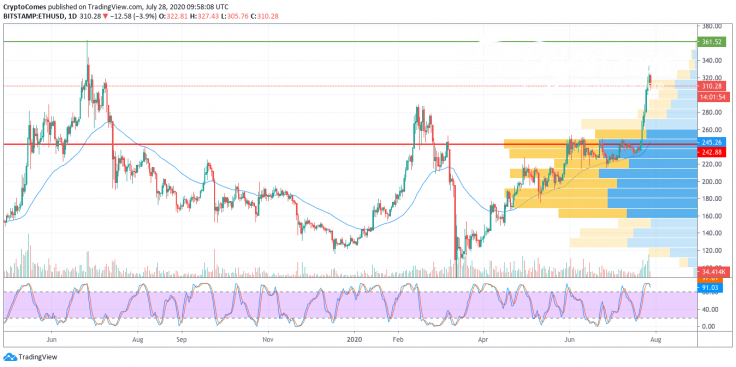
As of this morning, the pair has rolled back to the area of $320 and may continue to decline to the $310 level. At the same time, despite the strong overheating of the market, the Ethereum (ETH) price still retains a chance to break through to the two-year high ($364).
If today buyers are unable to overcome the resistance of $340, then the price will roll back to the trend line, which can halt the pullback.
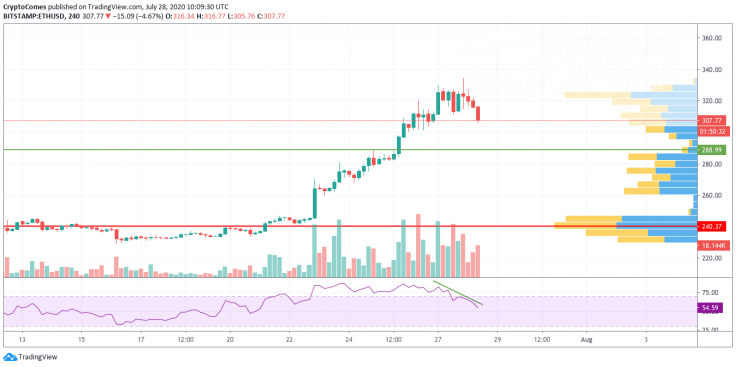
On the 4H chart, the bearish mood prevails over the bullish one as Ethereum (ETH) has not ended its correction. In addition, there is bearish divergence on the RSI indicator, which confirms the ongoing decline. Thus, the selling volume is high, which means that bears keep pushing the rate deeper. In this case, the end of the correction may be at the zone of $289.
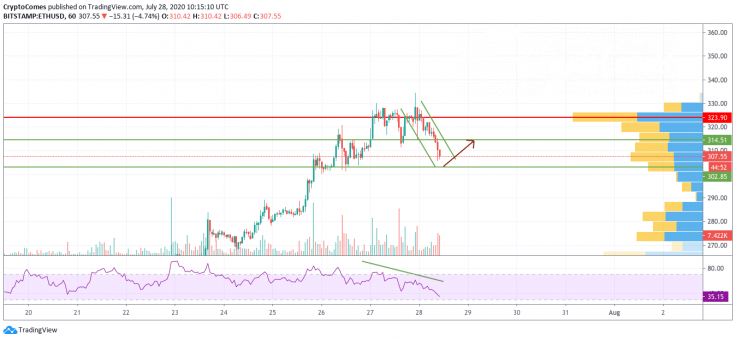
On the hourly chart, the leading altcoin is about to finish its correction wave as the RSI indicator has almost achieved the oversold zone. In this regard, traders may expect a bounce off the area around $300. However, the possible rise should be accompanied by a high trading volume; otherwise, it will be a false breakout.
Ethereum is trading at $307.89 at press time.


