
The cryptocurrency market may have entered a long-term correction as all of the top 10 coins are in the red zone.
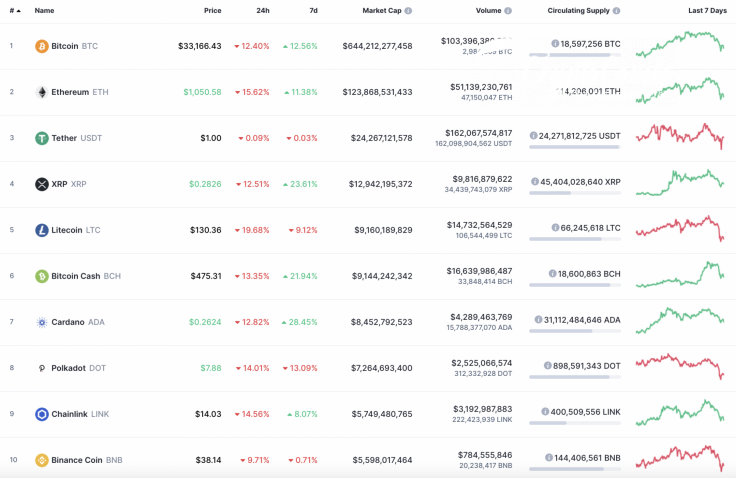
The dump of the most coins has affected cryptocurrency market capitalization, which has dropped below the $1 trillion mark.

The relevant data for Ethereum is looking the following way:
-
Name: Ethereum
-
Ticker: ETH
-
Market Cap: $119,671,017,107
-
Price: $1,047.85
-
Volume (24h): $50,688,637,720
-
Change (24h): -19.26%
The data is relevant at press time.
ETH/USD: Can one expect one more decline below $1,000 before continued growth?
Last Saturday, buyers consolidated in a sideways range at the level of average prices. On Sunday, bulls were able to set a new January high around the $1,353 mark.
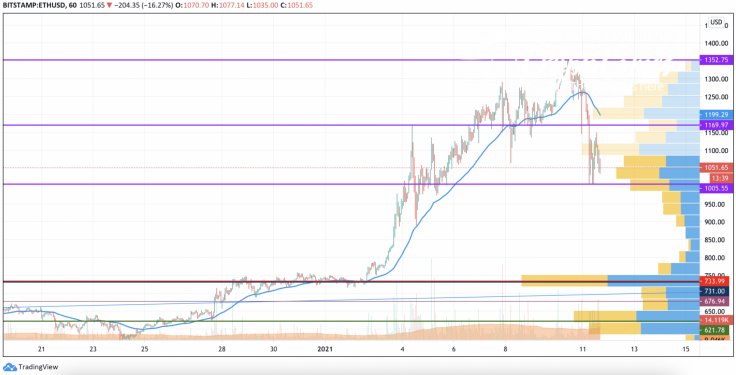
On Sunday afternoon, the Ether price returned to the hourly moving average EMA55 and, tonight, the bears pushed through this support. By morning, they were close to the retest of the psychological level of $1,000.

At the moment, the price bounced to the area of $1,100. If bearish pressure stops at the same time, the pair will recover to the area of average prices. If the bearish momentum repeats, the pair will roll back to the support at $890.
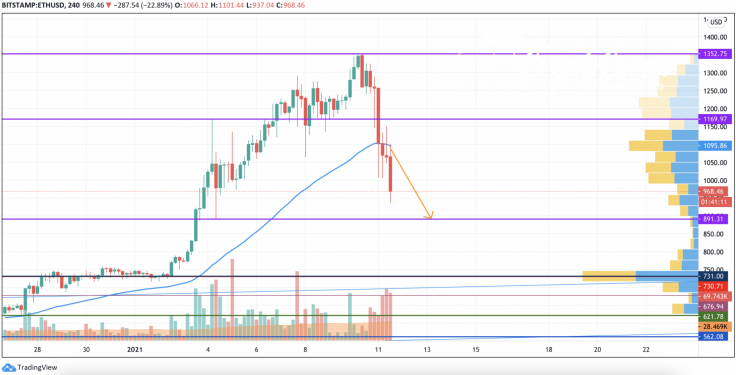
On the 4H chart, bears are showing power, and there is no signal of a bounceoff at the moment. From the technical point of view, the drop may continue to the support at $890, where bulls may seize the initiative in the short-term case.
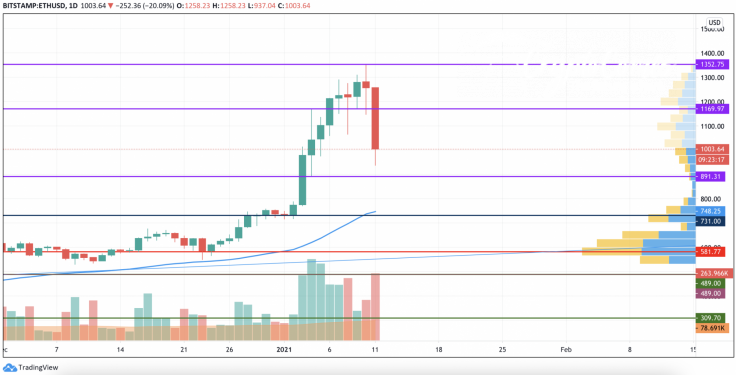
On the bigger chart, the area around $700 may the be point where a potential bounceback may occur. However, at the moment, sellers are controlling the situation based on the high trading volume.
Ethereum is trading at $1,027 at press time.


