Yesterday, most of the coins were in the green. Today, the picture has changed. Neither the bulls nor the bears control the situation in the market. One needs to point out that the rate for Chainlink (LINK) has skyrocketed by 15.92% over the last 24 hours.
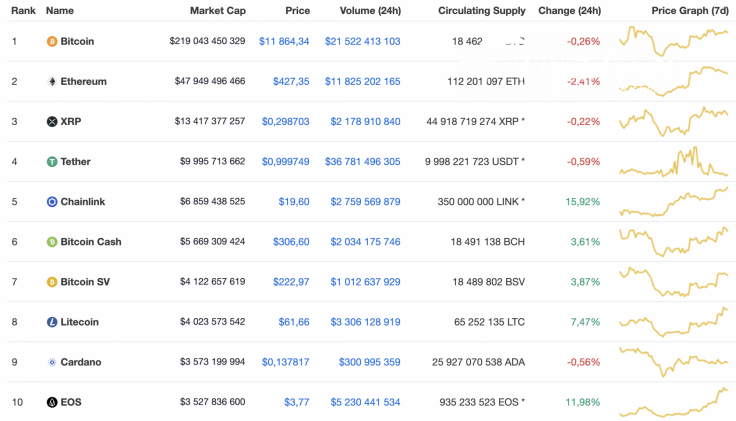
Even though the cryptocurrency market has moved into the red to a certain extent, the total market capitalization has increased by around $1B in the last 24 hours.

Below is the relevant data for Ethereum (ETH) and how it's looking today:
-
Name: Ethereum
-
Ticker: ETH
-
Market Cap: $47,946,297,599
-
Price: $427.32
-
Volume (24H): $11,301,614,402
-
Change (24h): -2.23%
The data was relevant at press time.
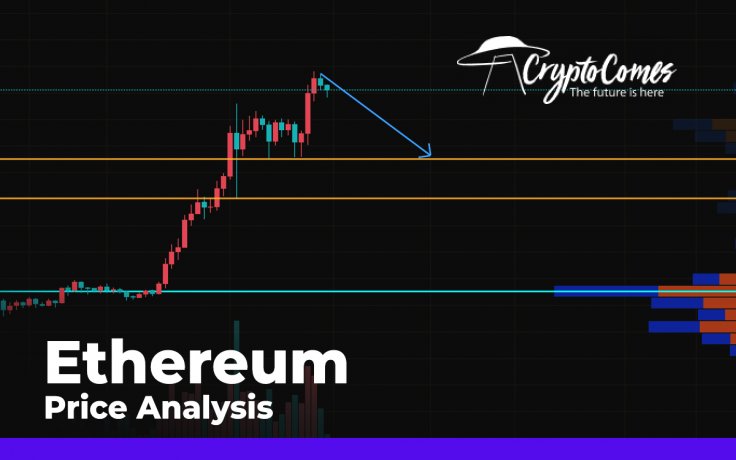
ETH/USD: How Deep a Correction It May Be Before Growth Continues?
Even though Ethereum (ETH) has lost much more than Bitcoin (BTC) since yesterday, the price change from last week constitutes an increase of +8.75%.
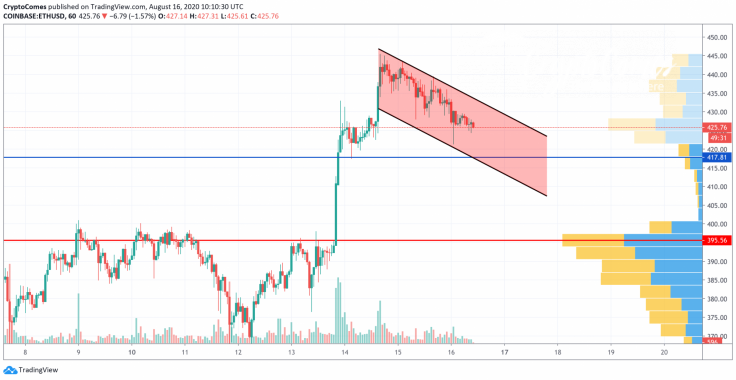
Looking at the hourly chart, the leading altcoin is trading within a descending channel, and there are no reasons that a short-term trend change will occur. The trading volume is at its lowest level, as well as its liquidity. Although the long-term picture is bullish, the ongoing decline may continue towards the closest support level at $417, where buyers might show their strength.

Looking at the bigger time frame, the situation is also bearish. The Relative Strength Index (RSI) is forming a divergence, which confirms the presence of sellers. What is more, the lines of Moving Average Convergence/Divergence (MACD) has just entered a 'short' zone.
The last but not least refers to a low liquidity level for the moment. All in all, Ethereum (ETH) is about to continue its ongoing decline between the $400-$410 area. In case the bears push it below $400 and fix it there, the long-term bullish trend will be cancelled.
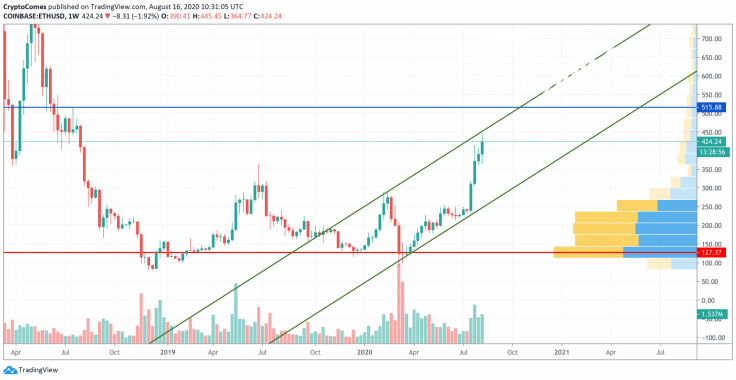
Looking at the weekly chart, the bullish mood is relevant and from a long-term perspective, the main target is above the crucial $500 mark. The trading volume is increasing, which confirms the intention of buyers to push the rate of the chief altcoin higher. In this particular case, the next important resistance level is at $515, which might be attained by the end of the current year.
At press time, Ethereum was trading at $423.73.


