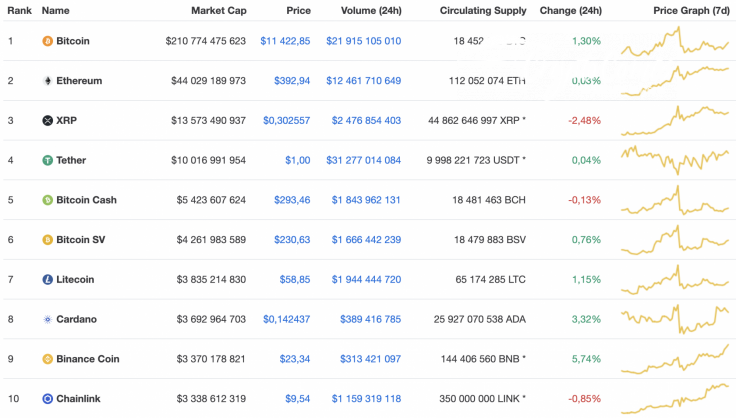
The cryptocurrency market is located in the sideways trend as neither bulls nor bears are controlling the situation at the moment. The biggest gainer out of the Top 10 list is Binance Coin (BNB), whose rate has risen by 5.74% since yesterday.
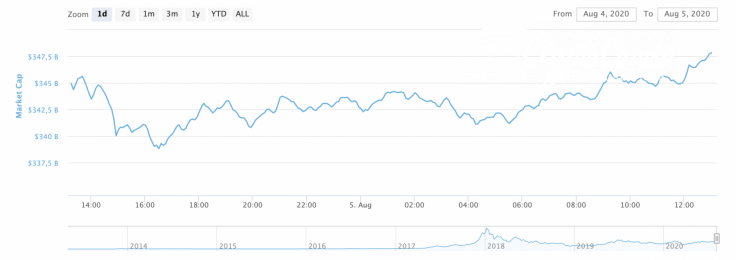
Meanwhile, cryptocurrency market capitalization keeps slightly increasing and the current index makes up $348 bln.
The relevant data for Ethereum looks like this:
-
Name: Ethereum
-
Ticker: ETH
-
Market Cap: $43,998,014,497
-
Price: $392.66
-
Volume (24h): $12,501,325,571
-
Change (24h): 0.03%
The data is relevant at press time.
ETH/USD: Can one expect another attempt to reach $400?
Ethereum (ETH) trading volumes dropped significantly yesterday. The pair consolidated in a narrowing sideways range around $390. The bears could not push through the support of $380, and the buyers did not manage to restore the price to the psychological resistance of $400.
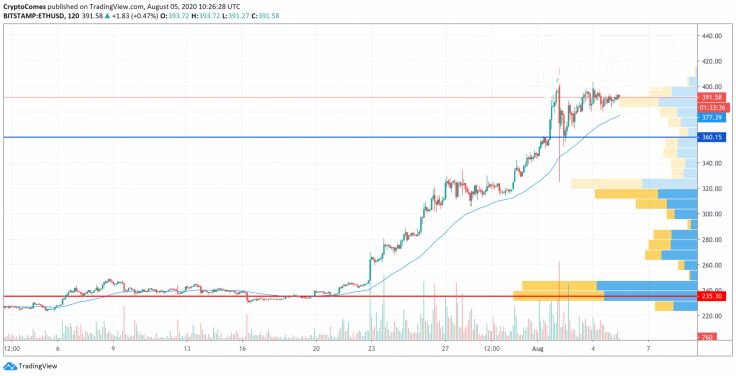
If today the bulls are able to increase volumes above the average, they will overcome the four hundred dollar mark and update the annual maximum of around $420.
The strengthening of the bears will knock the price out of sideways consolidation and roll the pair back below the average price level to the support of $360.
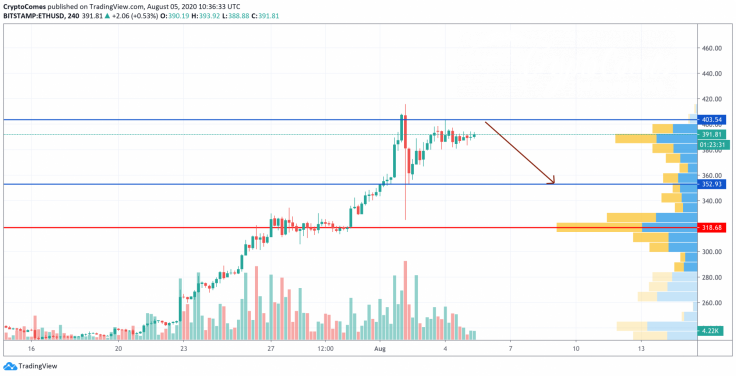
On the 4H chart, Ethereum (ETH) is trading as part of a correction phase after a drop from $415. It is too early to consider updating the local peak as the trading volume is declining. However, liquidity is still high, which means that bulls can make a retest of $400 before an upcoming price drop. In this case, the support is located around $350.
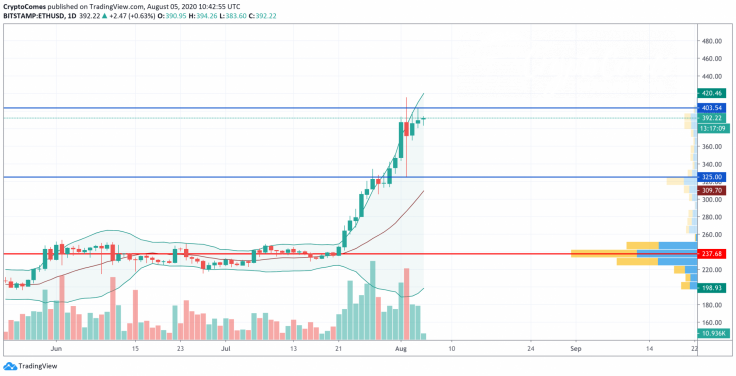
On the longer time frame, buyers are losing their power as there are long wicks. The trading volume, along with liquidity, is low and an obstacle for bulls hoping to push the rate of Ethereum (ETH) higher. For this reason, the more likely price action is a decline to the basic line of the Bollinger Bands indicator in the area between $300 and $325.
Ethereum is trading at $392.11 at press time.


