The new week has started with the continued growth of the cryptocurrency market. Most of the coins are in the green zone, except for Chainlink (LINK), whose rate has declined by 4.13% over the last day.
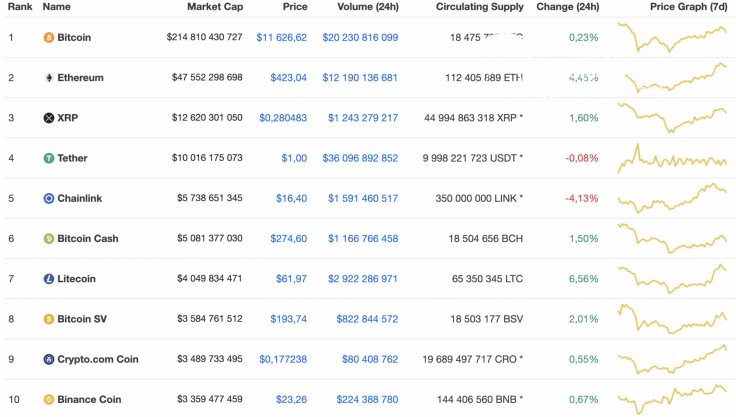
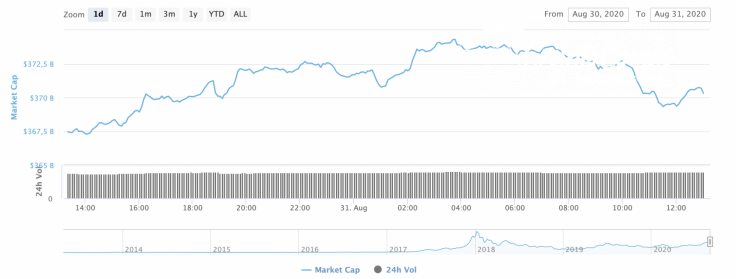
The market capitalization has also increased by a few billion and now is $370 bln.
The relevant data for Chainlink today:
-
Name: Chainlink
-
Ticker: LINK
-
Market Cap: $5,722,209,638
-
Price: $16.35
-
Volume (24h): $1,547,620,596
-
Change (24h): -4.68%
The data is relevant at press time.
LINK/USD: Analyzing the potential bounce off zone?
Chainlink (LINK) has failed to fix above $17 and confirmed the ongoing decline as a part of the correction phase. The rate of the 5th most popular coin has gone down by 4% while the price change over the last week has been +6.58%.
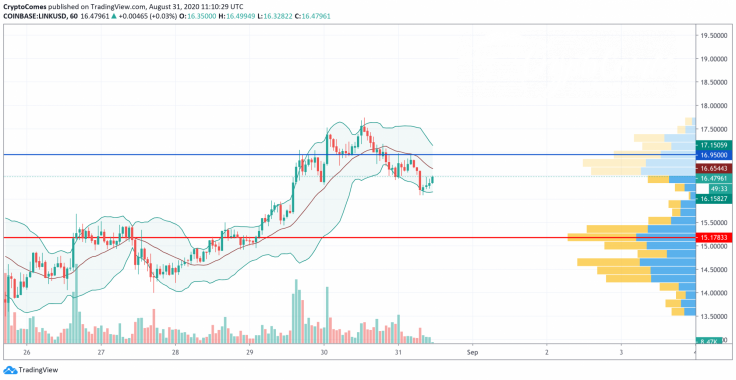
On the hourly chart, Chainlink (LINK) is located between the support line of the Bollinger Bands indicator and the basic one. Although the drop remains the primary scenario, one may expect a slight rise to the resistance at $16.95. At that point, there is a high possibility of a false breakout. However, if bulls seize the initiative and fix above $17, the long-term bullish trend will continue.

On the 4H time frame, bears are becoming more powerful as the trading volume is going down. What's more, the lines of the MACD indicator have just entered the bearish zone.

Besides, liquidity is high in the range of $15-16. To sum up, the more likely scenario is a decline to the support at $15.68.
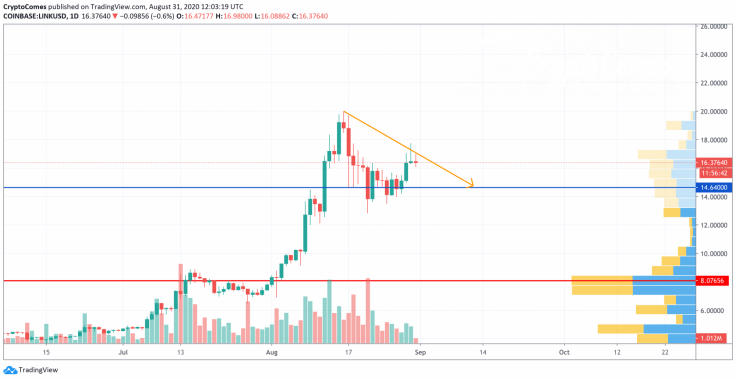
On the daily chart, sellers are also more active than buyers. At the moment, there are no prerequisites for a possible reversal as the buying volume is low. Thus, the falling channel formed on Aug. 16 has not been broken. In this case, a decline to $14.64 may occur soon if bulls do not seize the initiative.
Chainlink is trading at $16.35 at press time.


