The situation on the cryptocurrency market has completely changed over the last day. All Top 10 coins have switched to red and are now located under bearish influence.
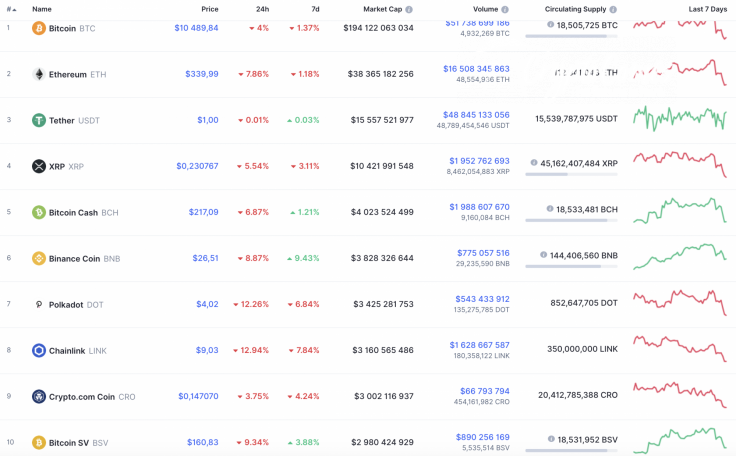
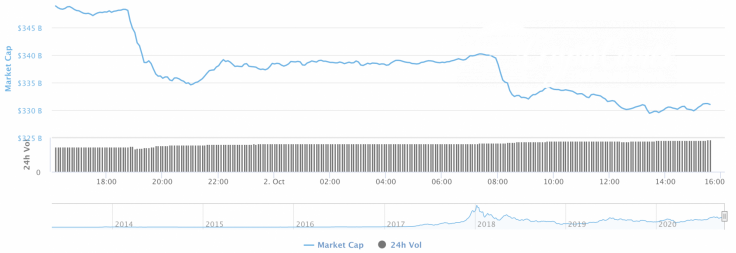
Respectively, the market capitalization has dropped and is now around $15 bln since yesterday.
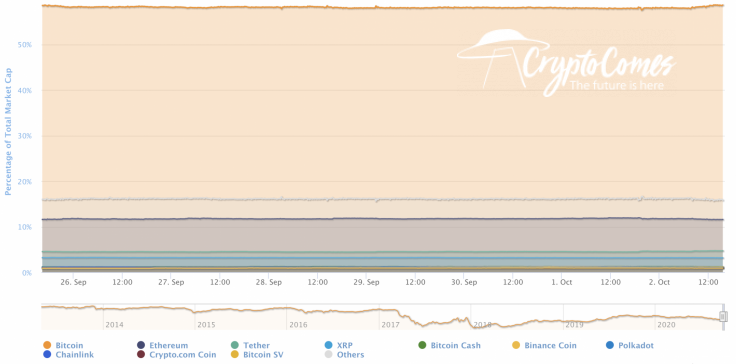
As Bitcoin (BTC) has lost much less than other coins, its market share has slightly gone up and is now 58.2%.
The relevant data of Cardano is looking the following way:
-
Name: Cardano
-
Ticker: ADA
-
Market Cap: $2,849,345,950
-
Price: $0.091582
-
Volume (24h): $881,051,842
-
Change (24h): -10.84%
The data is relevant at press time.
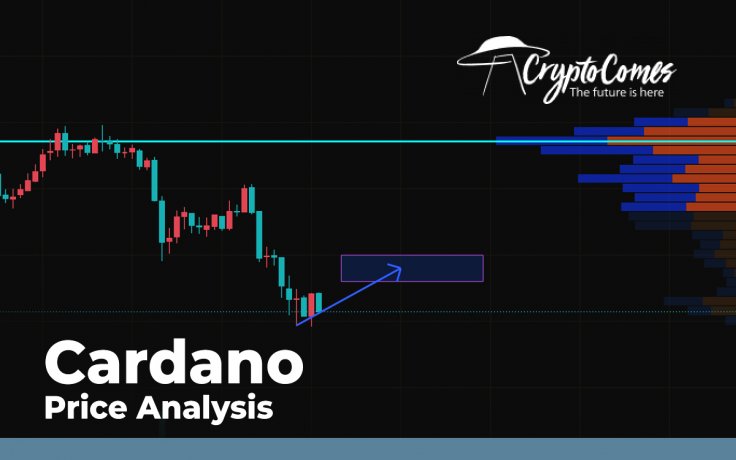
ADA/USD: When can traders expect a decline to $0.09?
Cardano (ADA) is one of the biggest losers among the altcoins. The rate of the digital asset has declined by almost 11% just over the previous 24 hours.
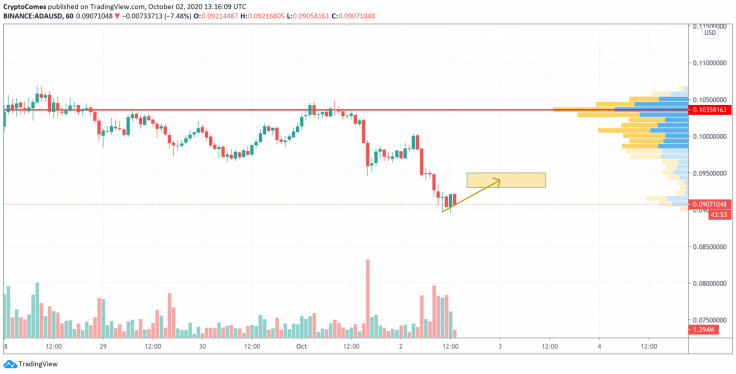
On the hourly chart, Cardano (ADA) has tested the local support at $0.09. From the technical point of view, buyers' power is not enough for a reversal. However, short-term growth may happen as the selling trading volume has decreased. In this regard, bulls may get the rate of ADA to the yellow range of $0.093-$0.095 shortly.
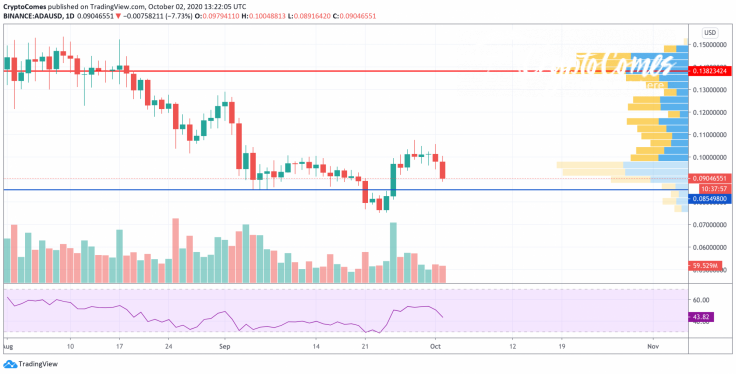
On the daily time frame, bears are controlling the situation as buyers could not seize the initiative and make a reversal. Furthermore, the value of the Relative Strength Index indicator has not reached the oversold zone yet, which means that the decline may continue.

If that occurs, the nearest support zone where growth is possible is the $0.085 mark.
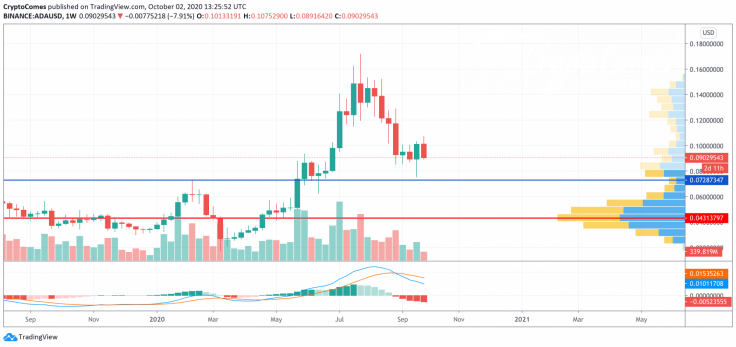
The bearish scenario is also relevant on the weekly chart. The lines of the MACD indicator have already entered the "short" zone, and the impulse is only increasing which means that a fall is about to continue. Thus, most of the liquidity is located in the area of $0.04-$0.05 that suggests a possible decline to that zone.
Cardano is trading at $0.0911 at press time.


