Bears have become more active, which has affected the rate of many coins. Polkadot (DOT) is the only crypto from the Top 10 coins that is located in the green zone.
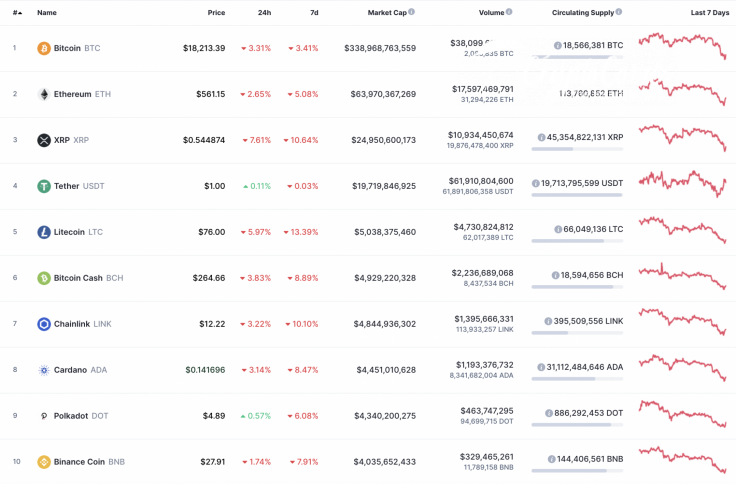
The key statistics for Bitcoin (BTC), Ethereum (ETH) and XRP:
|
Name |
Ticker |
Market Cap |
Price |
Volume (24h) |
Change (24h) |
|
Bitcoin |
BTC |
$338,968,763,559 | $18,236.41 | $38,099,617,631 | -3.06% |
|
Ethereum |
ETH |
$63,970,367,269 | $562.04 | $17,597,469,791 | -2.25% |
|
XRP |
XRP |
$24,950,600,173 | $0.545925 | $10,934,450,674 | -7.07% |
BTC/USD
Yesterday, in the morning, the Bitcoin (BTC) price once again hit the upper border of the triangle and began to roll back below the average price level. The pullback turned out to be quite deep and broke through the lower border of the triangle, as a result of which the pair fell out of the narrowing range.

The BTC price tested the $18,000 level tonight. If buyers are unable to restore the price to the hourly EMA55, then the decline may continue to support at $17,500.
Bitcoin is trading at $18,215 at press time.
ETH/USD
Yesterday morning, the price of Ethereum (ETH) was unable to overcome the upper border of the triangle, which turned the pair downward. In the area of the lower border, the pressure from bears intensified, and the altcoin came out of the narrowing side channel.
By the end of the day, the pair tested the nearest support level of $560 and, overnight, the decline continued to the next weak level of $540.
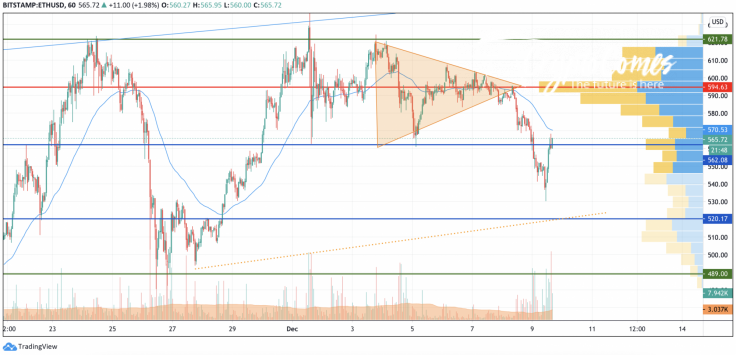
If, today, buyers do not take emergency measures to save the price from a deep peak, then sellers will test the trend line before the end of the day.
Ethereum is trading at $567.08 at press time.
XRP/USD
Yesterday, the lower border of the sideways range was steadfastly holding back the attempts of sellers to knock out the pair from the sideways channel. Late in the evening, bears intensified the onslaught and broke through this trend support, pulling the price back to the area of the $0.550 mark.
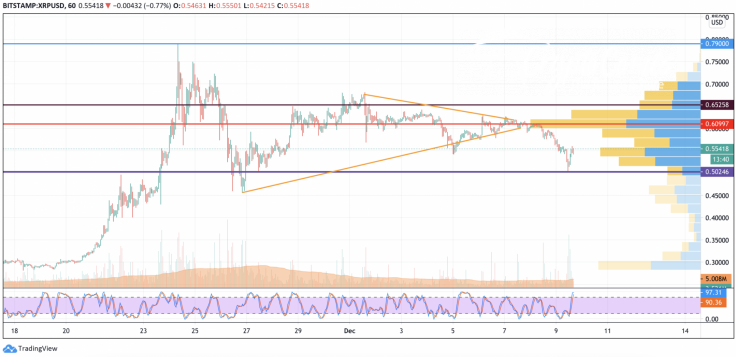
This morning, buyers may try to restore the pair to the area of average prices but, if the lower border of the purple triangle acts as resistance, then until the second half of this week the decline will continue below the psychological level of $0.50.
XRP is trading at $0.5512 at press time.


