Bulls have turned out to be more powerful than bears as most of the Top 10 coins are located in the green zone. Mainly, Cardano (ADA) is the top gainer among them, rising by almost 11% since yesterday.
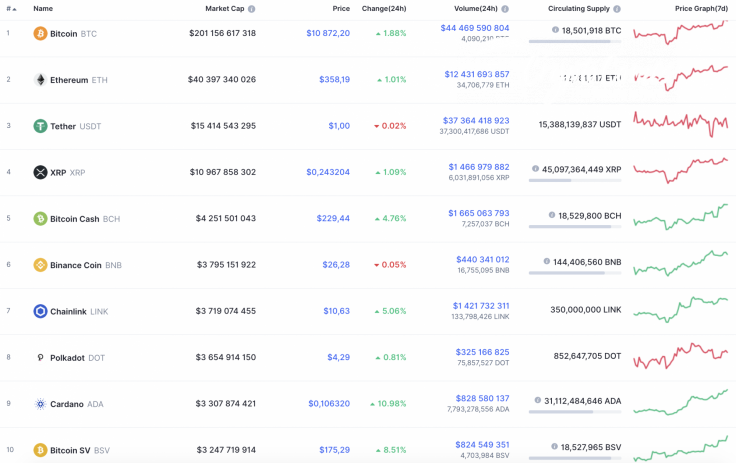
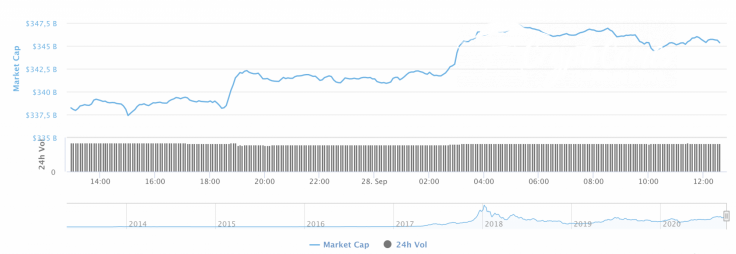
Respectively, the total market capitalization has risen by $10 bln and is now at $348 bln.
The relevant data for Bitcoin Cash is looking the following way:
-
Name: Bitcoin Cash
-
Ticker: BTC
-
Market Cap: $4,256,048,820
-
Price: $229.69
-
Volume (24h): $1,688,249,106
-
Change (24h): 4.73%
The data is relevant at press time.
BCH/USD: Can a retest of $250 occur before a decline starts?
Bitcoin Cash (BCH) has shown much better performance than the Top 3 coins. Mainly, the altcoin has gained $10 to its overall rate over the previous week.
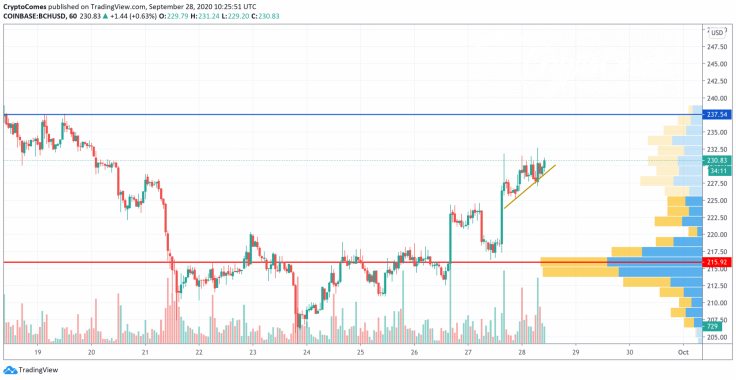
Bitcoin Cash (BCH) is slowly going up after it has retested the support at $217. On the hourly time frame, ongoing growth is accompanied by a rising trading volume. However, the Bitcoin fork is unlikely to set new local peaks as the liquidity is low and the current rise may be considered a fake one. To sum up, the endpoint of the price increase may be the resistance of $237.54, which might be attained shortly.
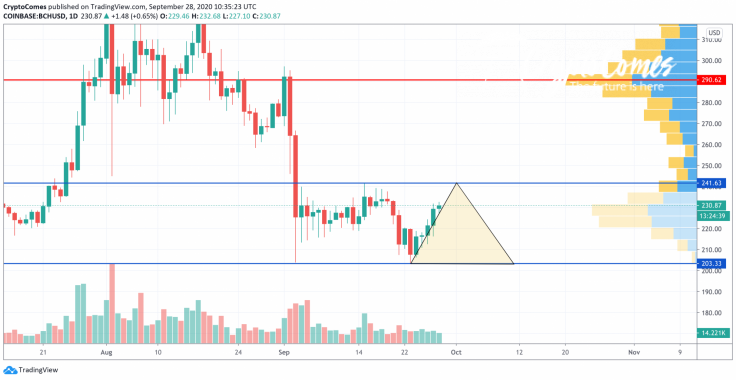
On the daily chart, short-term growth is also the more probable scenario; however, the mark of $241 may be the last one before a decline starts. Such a statement is supported by the relatively low trading volume, which is not going up while the price of the altcoin is increasing. That is why traders may see a false breakout, followed by a drop to $203.
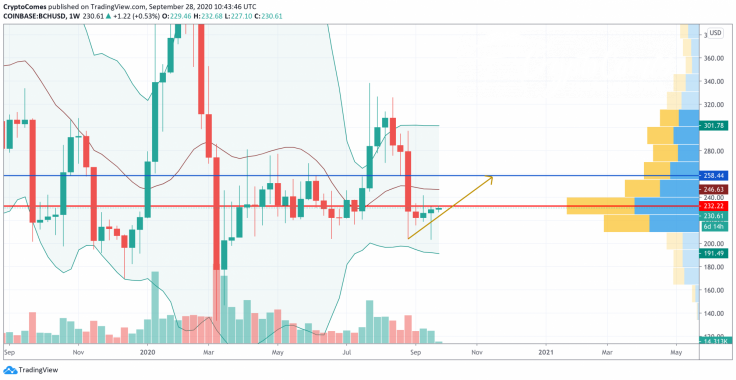
On the weekly time frame, the long-term bullish scenario remains relevant as Bitcoin Cash (BCH) has kept trading above the crucial $200 mark. At the moment, the altcoin is located above the basic line of the Bollinger Bands indicator, which means a high probability of seeing it at the resistance of $258.44 by mid-November 2020, as trading volume and liquidity remain at the same level.
Bitcoin Cash is trading at $230.75 at press time.


