The new week has begun with a continued decline on the cryptocurrency market. Almost all coins from the Top 10 list are in the red zone except for Binance Coin (BNB), whose rate has increased by 1.20% over the last day.
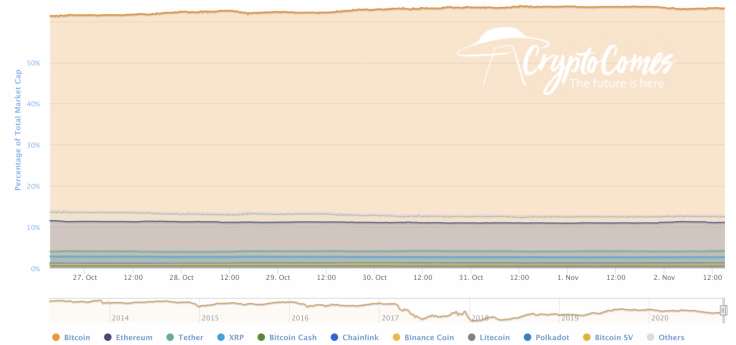
As the altcoins market is more volatile than the main crypto, the dominance rate of Bitcoin (BTC) has strengthened and now constitutes 63.3%.
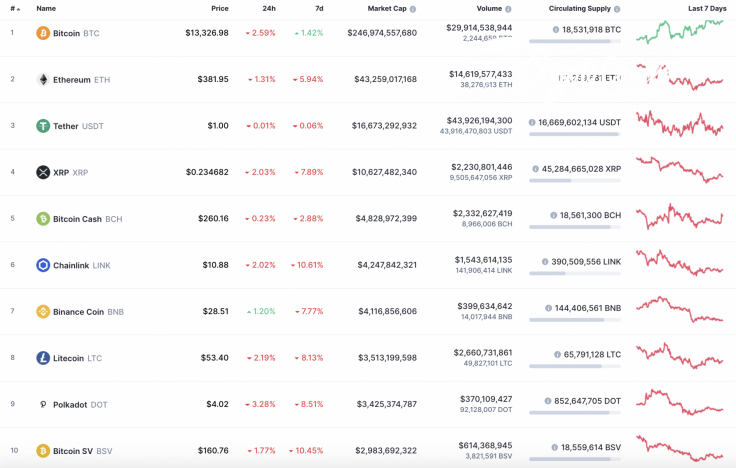
The relevant data for Bitcoin is looking the following way:
-
Name: Bitcoin
-
Ticker: BTC
-
Market Cap: $246,770,887,546
-
Price: $13,315.99
-
Volume (24h): $30,468,817,960
-
Change (24h): -2.59%
The data is relevant at press time.
BTC/USD: Is the current decline a move to gain liquidity for a retest of $14,000?
Over the past weekend, the bulls were able to continue the rise in the price of Bitcoin (BTC) and renewed a two-year high at $14,100. Immediately after the high, the pair rolled back to the support of $13,600 and, so far, buyers have not been able to limit the decline to the 61.8% fibo level ($13,346).
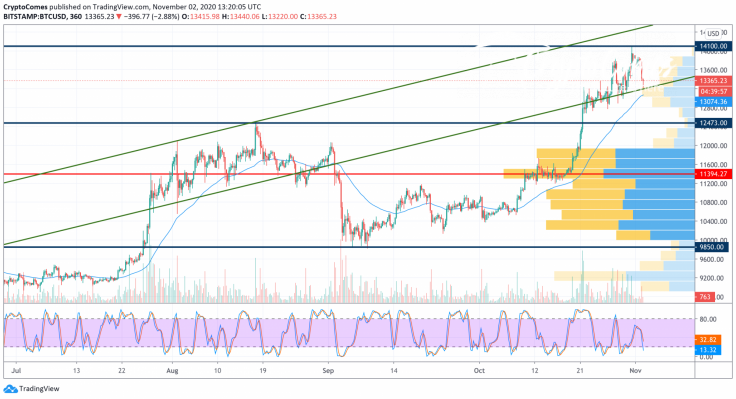
The lack of significant support outside the ascending channel could lead to an avalanche-like decline in the area of average prices and a breakout of the $12,000 level.

If one assumes that the bulls will be able to keep the pair in the upward channel and continue to grow in an overheated market, then a retest of the level of $14,400 is possible.
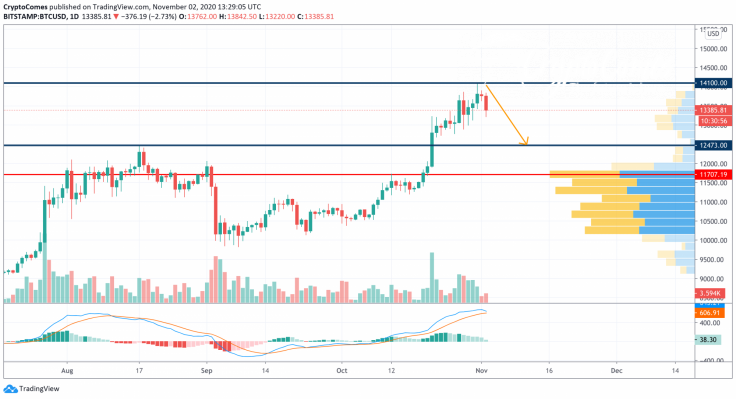
On the daily chart, Bitcoin (BTC) has started the correction phase after a false breakout of the $14,000 level. The short-term scenario is bearish as buyers lack power to retest the peaks due to low liquidity. In addition, the lines of the MACD indicator are about to enter the red zone, which will confirm sellers' pressure. In this case, the next support is located at around $12,500.
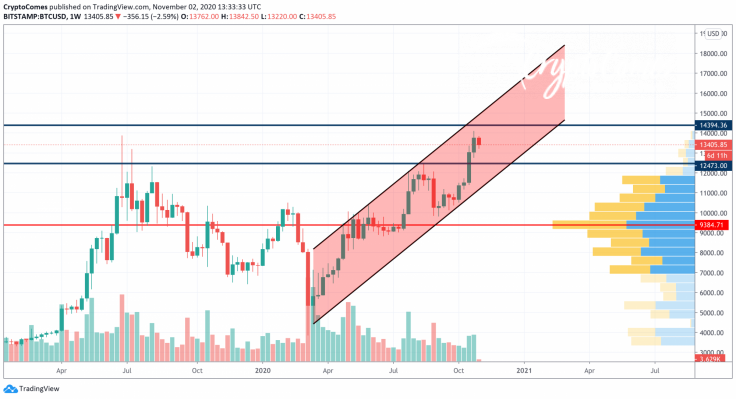
On the longer time frame, the ongoing decline is about to be considered a short-term correction but not the start of a long-term bearish cycle. Bitcoin (BTC) keeps trading in the rising channel, and the resistance at $14,400 set in 2019 has not been tested yet. In this case, this week, the chief crypto may locate in the bearish zone before another growth attempt to conquer $14,000.
Bitcoin is trading at $13,421 at press time.


