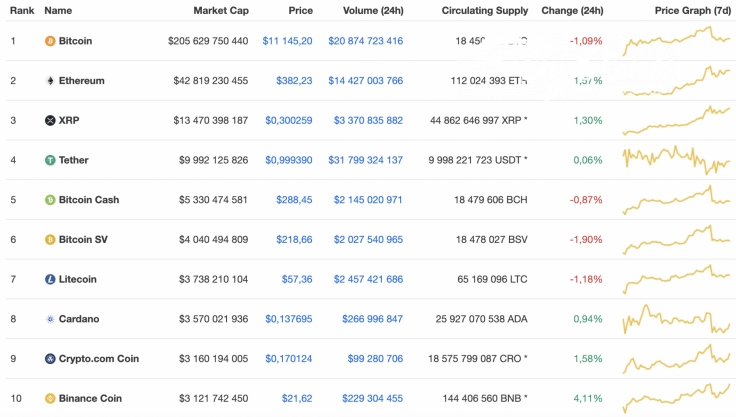
After a drop over the weekend, some coins from the Top 10 list may recover. However, this prediction does not apply to most of them. Bitcoin (BTC) and its forks are in the red zone. The biggest loser is Bitcoin SV (BSV), whose rate has declined by 1.90% over the last day.
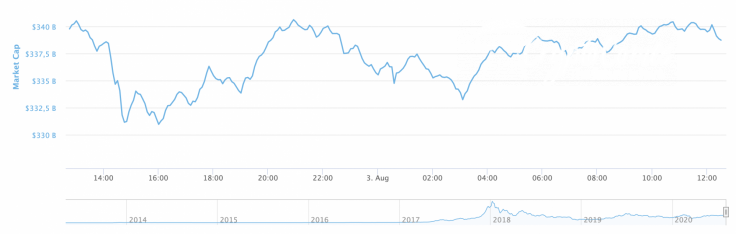
A slight drop in cryptocurrencies has affected market capitalization, which has decreased by $2 bln and now sits at $338 bln.
The relevant data for Bitcoin stacks up this way today:
-
Name: Bitcoin
-
Ticker: BTC
-
Market Cap: $205,559,991,867
-
Price: $11,141.41
-
Volume (24h): $20,866,259,551
-
Change (24h): -1.07%
The data is current at press time.
BTC/USD: Can Bulls reach the rate of $12,000 again this week?
On Saturday morning, buyers were able to overcome the level of $11,394 and continue to rise to the target level of $12,000 by Saturday evening. On Sunday morning, Bitcoin (BTC) set an annual high at $12,100, after which it started to fall.
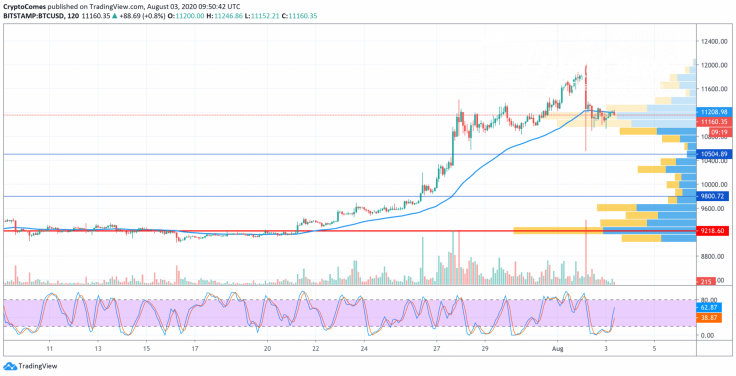
The point of the daily minimum was fixed at the level of $10,560 but, almost immediately, the pair rebounded to the area of $11,200. In the first half of the day, the recovery continued until the buyers came up against the $11,395 resistance, which they could not overcome.

In the second half of the day, trading volume began to decline, and the pair tried to gain a foothold in a sideways channel in the area of average prices. Overnight, the price of BTC retraced below the two-hour EMA55 and, as of this morning, buyers could not yet overcome the resistance of this moving average.
At the moment, the Stoch RSI indicator lines have left the overbought zone and indicate an upcoming continuation of the decline toward the trend line (the psychological mark area of $10,000).
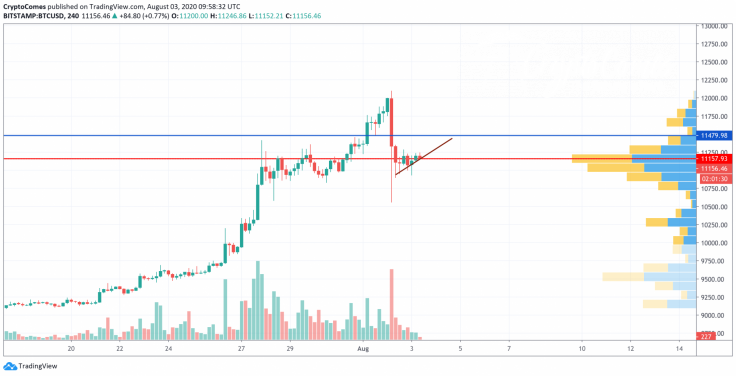
On the 4H chart, a potential rise is possible—not in the form of a correction after Sunday's drop but an attempt to reach the $12,000 mark. The trading volume is low, but the selling volume is at the bottom. That is why the more likely scenario is slight growth to the zone of $11,500 before another bearish wave begins.
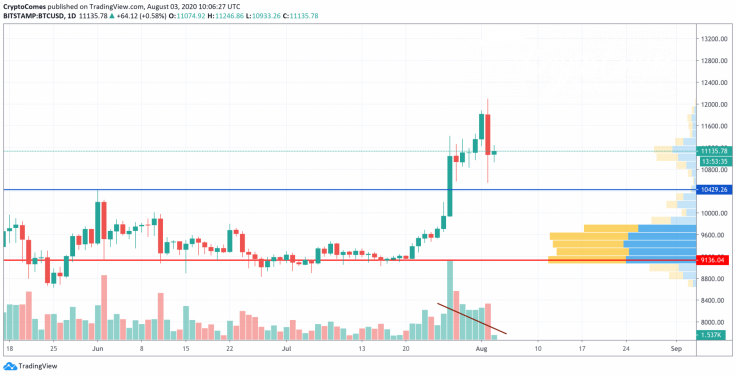
On the daily time frame, the situation is not that positive. The trading volume is decreasing, which means that there are high chances for a further decline. If Bitcoin (BTC) cannot rise above $11,300 in the next few days, bears may push it back to $10,500 and below shortly.
Bitcoin is trading at $11,150 at press time.


