The positive mood on the cryptocurrency market has slowed down as some of the coins have switched to red. Yesterday's gainer, Cardano (ADA), has lost 6% over the past 24 hours.
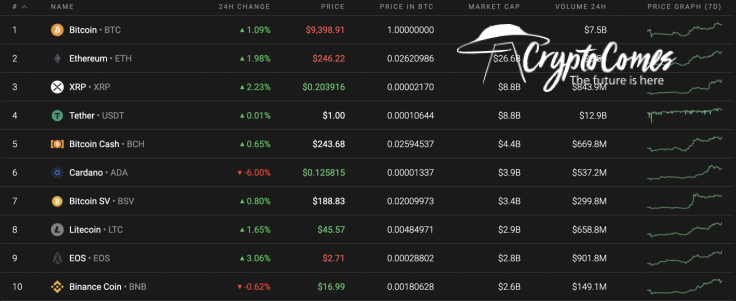
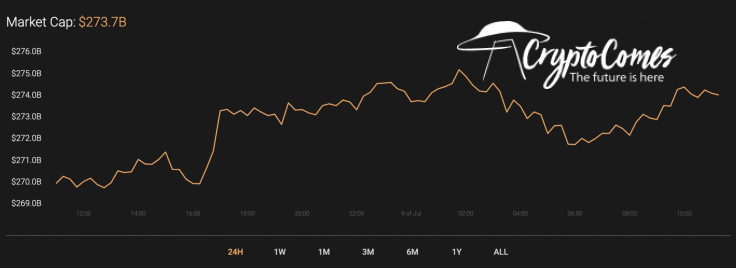
Meanwhile, the market capitalization keeps rising, having amounted to about $3 Bln over the past 24 hours.
The relevant data for Bitcoin is as follows.
-
Name: Bitcoin
-
Ticker: BTC
-
Market Cap: $172,986,314,175
-
Price: $9,387.33
-
Volume (24h): $19,323,202,531
-
Change (24h): 1.22%
This data is relevant at press time.
BTC/USD: Is there enough power to reach $9,500?
Yesterday morning, trading volumes were below average and the price of Bitcoin (BTC) was stuck in the resistance area of $9,300. Sellers tried to push the price to the two-hour EMA55, but buyers were able to form bullish momentum and broke the key $9,300 resistance.
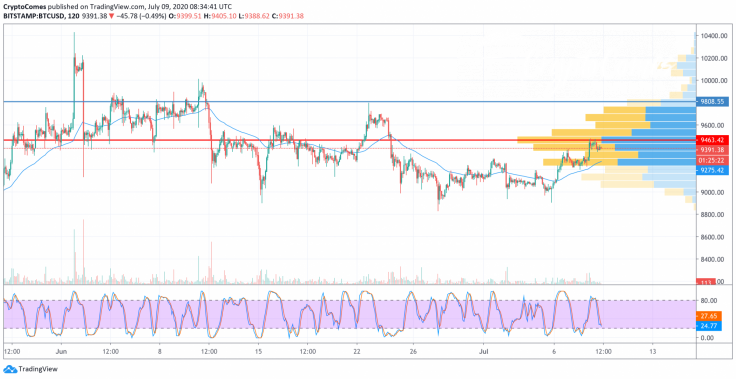
In the afternoon, the pair tested $9,441 and set a daily maximum at around $9,480. The price was not able to stay in the maximum zone and rolled back slightly to below $9,400. Today, buyers will again try to set a new July maximum and if they manage to break through the resistance at $9,441, then the next maximum could be in the $9,600 area. At medium volumes, it might not be possible to continue growth, and Bitcoin (BTC) may get stuck in a narrow consolidation. In this case, even a weak bearish impulse could roll the price back to the support at the two-hour EMA55.
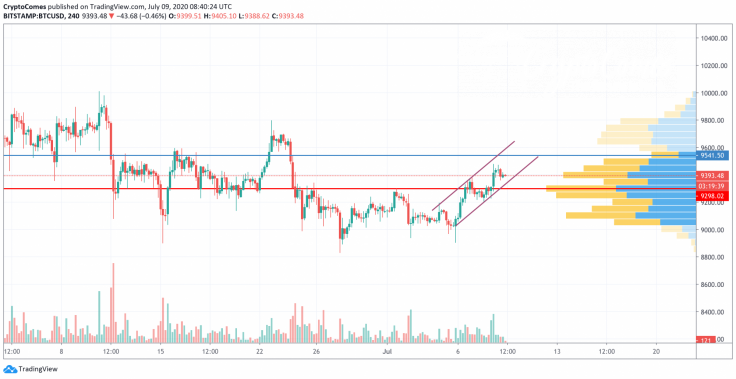
On the 4H time frame, Bitcoin (BTC) is trading in a rising channel. Trading volume dropped slightly after yesterday’s rise. However, it is still at a medium level, which means that growth is possible. In this case, the nearest resistance is located in the $9,500-$9,550 area.
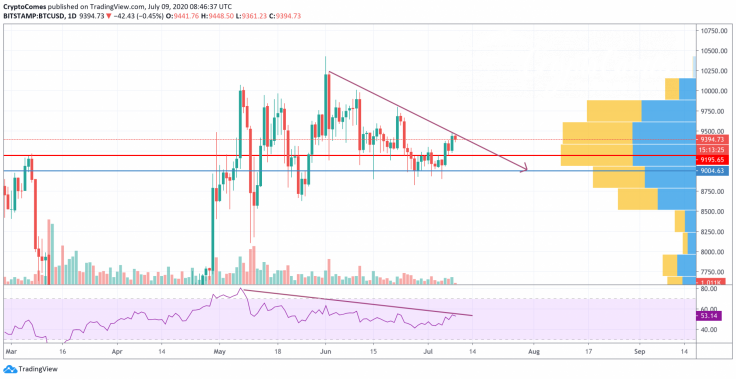
On the bigger chart, the leading crypto is still lacking enough strength to reach the psychological $10,000 mark. The low level of trading volume indicates that there is no pressure from buyers. In addition, a bearish divergence has been formed on the RSI indicator. The most likely scenario will be a drop to the first support area of $9,000 within days.
Bitcoin is trading at $9,394 at press time.


