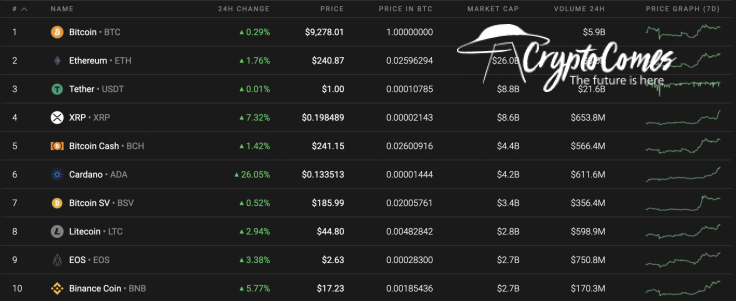
The positive mood on the cryptocurrency market has strengthened as altcoins keep rising, while Bitcoin (BTC) is in a sideways trend. Cardano (ADA) remains the top gainer, having skyrocketed by 26% since yesterday.
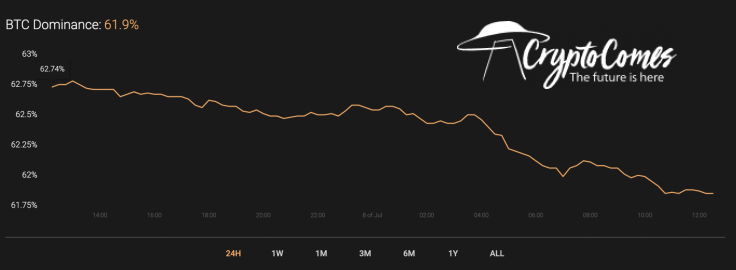
Meanwhile, the dominance rate of Bitcoin (BTC) keeps decreasing against the rise of altcoins and is now 61.9%.
The relevant Bitcoin data stacks up this way:
-
Name: Bitcoin
-
Ticker: BTC
-
Market Cap: $170,836,611,893
-
Price: $9,271.16
-
Volume (24h): $16,852,930,229
-
Change (24h): 0.24%
The data is relevant at press time.
BTC/USD: Is the Remaining Bull Power Enough to Get to $9,400?
Yesterday morning, the volume of purchases decreased, and before the end of the day, the bears pushed the price of Bitcoin (BTC) to a two-hour EMA55.
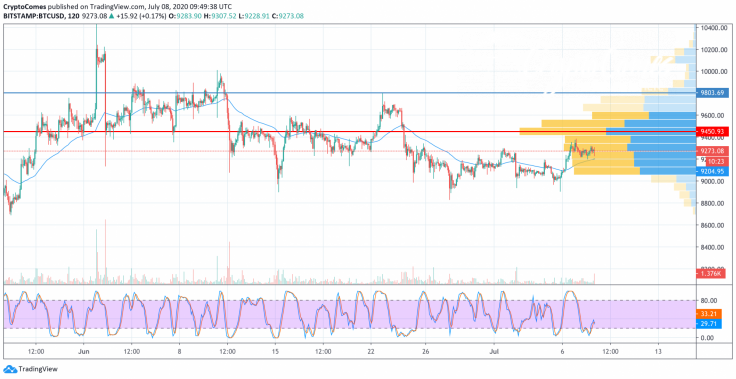
Late at night, the average volume of purchases contributed to the restoration of prices in the resistance area of $9,300. The growth dynamics look rather sluggish, and the pair so far cannot gain a foothold above this key resistance.
Because there is no clear signal for continued growth above the level of $9,441, the price of Bitcoin (BTC) may roll back below the two-hour EMA55. However, if large buyers take part in the auction today, the coin will be able to test the POC line ($9,490).
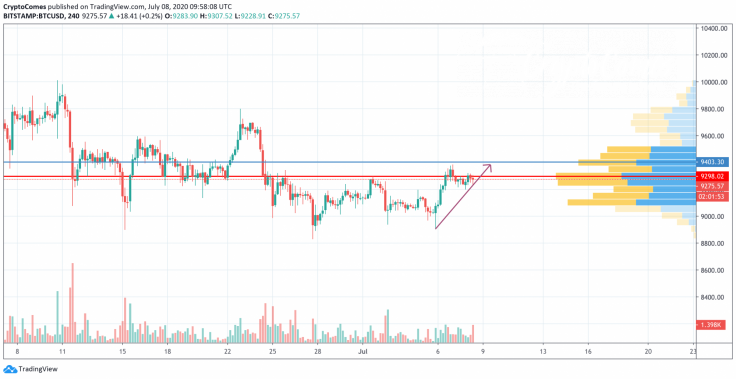
On the 4H time frame, the bullish scenario is also still relevant as bears could not push Bitcoin (BTC) below the $9,200 mark. What's more, the trading volume is at the medium level that confirms the buyers' interest in the current area. Likewise, growth might continue to the next resistance at $9,400, which may be attained shortly.
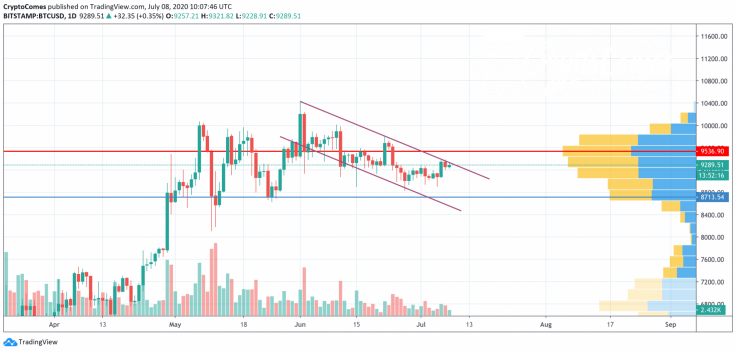
On the daily chart, a continued rise after reaching the zone of $9,400-$9,450 is unlikely to occur. First of all, it is confirmed by declining trading volume. In addition, Bitcoin (BTC) has been trading in the falling channel since the start of June, and one might expect a move to the bottom level. In this case, the zone of $8,700 may be the level at which bears find a bullish resistance.
Bitcoin is trading at $9,286 at press time.


