Having updated the ATH in 2019, Bitcoin keeps pushing the whole cryptocurrency market to new highs. Yesterday the price of BTC overcame the $9,500 mark, thereby updating the 13-month levels. The last time the first cryptocurrency traded in this zone was May 2018, after which it began a long decline.
The total market capitalization has risen to a maximum of $298 bln, the highest index since July 31, 2018. Most of the top coins are also showing growth against the US dollar; however, they are falling in correlation to BTC, except for Ethereum and Binance Coin (rising by 0.3% and 1% respectively).
BTC/USD
It looks like the leading crypto has set a new maximum for 2019. The rise has made up around 5% over the last 24 hours.
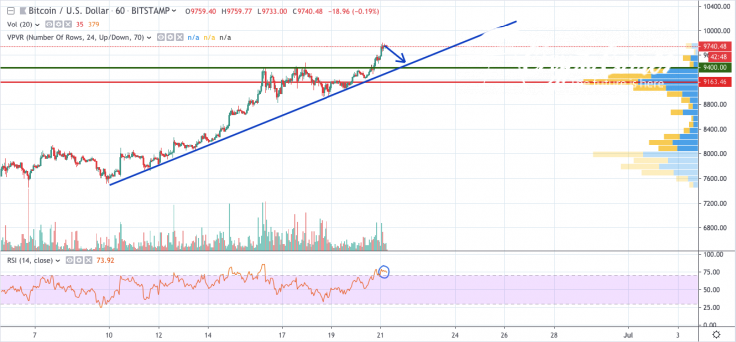
On the hourly chart, Bitcoin has been located in the uptrend for more than 10 days without a severe correction. In this regard, one should expect a slight rollback to the nearest support at $9,400 as a short-term idea. The RSI indicator also supports such a scenario, locating in the oversold zone.
The price of BTC is trading at $9,725 at the time of writing.
ETH/USD
The leading altcoin has gone up by 6% over the last day. Currently, it is the most significant growth index out of the top 5 assets.
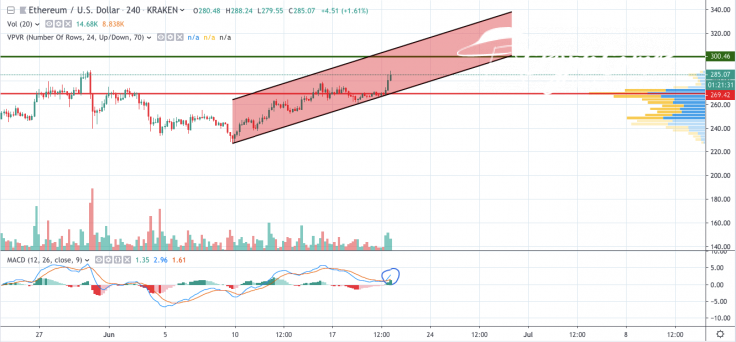
Ethereum is looking more bullish than Bitcoin, and the technical picture confirms this. On the 4-hour chart, ETH is located in the ascending channel, and the current levels are not the peaks. The MACD indicator is about to change the trend line and go even higher. In a short-term scenario, this may push Ethereum to a vital level of $300. Supposedly, that might happen until the end of June.
The price of ETH is trading at $284.72 at the time of writing.
XRP/USD
Ripple has been the least fluctuating asset over the past night compared to Bitcoin or Ethereum. Its quotes have increased by only 1%.
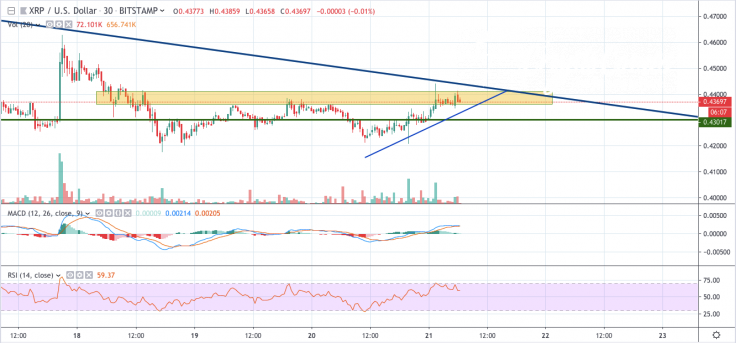
On the 30 minute graph, Ripple is still under the bearish mood, located below the peak at $0.46 formed on June 17. Regarding the short-term scenario, XRP is likely to be in a sideways trend in the yellow corridor of $0.4360-$0.4410 for the next few days. The neutral RSI indicator, as well as MACD back such tendencies.
The price of XRP is trading at $0.4369 at the time of writing.