The cryptocurrency market has faced a more profound correction than usual as most of the Top 10 coins are in the red zone. The only exception to the rule is Chainlink (LINK), which rate has gone up by 12.97% over the past day.
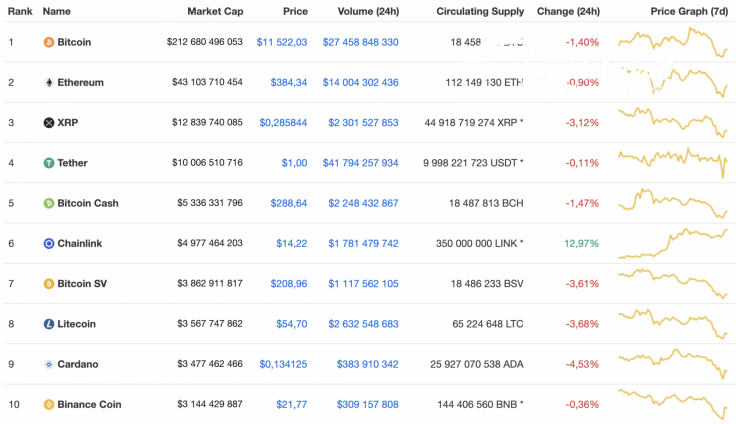
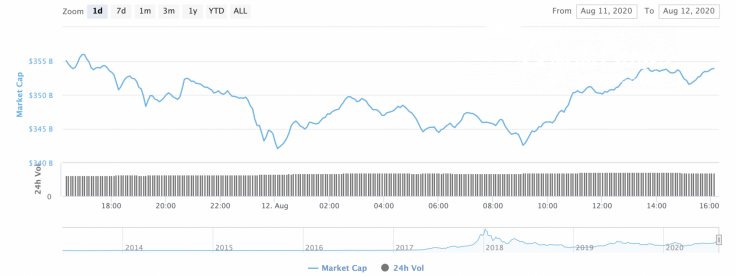
The total market capitalization has also declined over the last 24 hours and the current index makes up $353 bln.
The relevant data for XRP today:
-
Name: XRP
-
Ticker: XRP
-
Market Cap: $12,814,550,706
-
Price: $0.285283
-
Volume (24h): $2,263,167,842
-
Change (24h): -3.18%
The data is relevant at press time.
XRP/USD: When can bulls return to $0.30?
Yesterday, the psychological level of 0.30 USD could not withstand the onslaught of sellers, and the XRP price broke through the immediate support in the form of the two-hour EMA55.
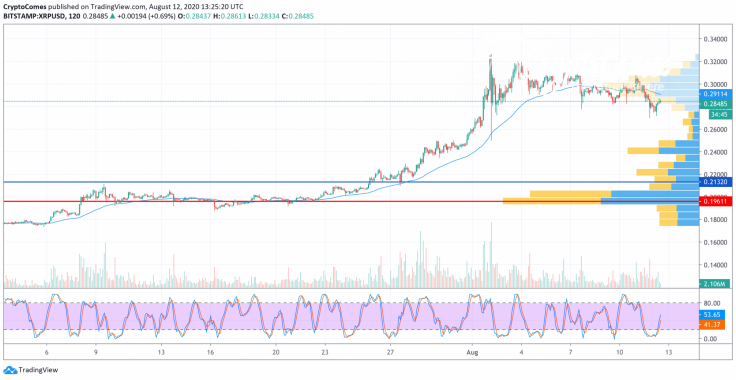
The decline was stopped only around the level of $0.28. But, as of this morning, the price decline may still continue to the area of the $0.26 mark. When the Stoch RSI indicator lines, in the oversold zone, form a reversal signal on the daily time frame, the pair might begin to recover to the psychological level of $0.130. It is possible that prior to this moment, bears will have time to push the price back to the support at $0.25.

On the 4H chart, XRP has formed a falling channel and there are no prerequisites for a trend change at the moment. From a technical point of view, the fall may decline to the bottom of the channel at $0.25.
Even though a slight growth to $0.30 is possible, such movement is likely to be considered a false breakout as the trading volume, as well as the liquidity level, is not enough to update peaks.
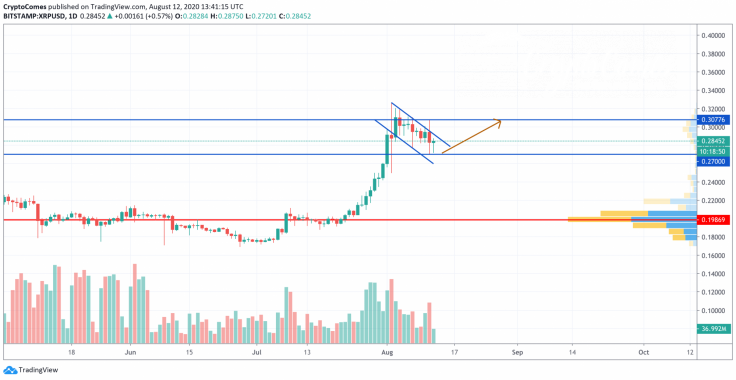
On the daily time frame, the decline may finish soon as XRP is about to retest the $0.27 level where bulls may show their strength. The selling trading volume is at the lowest level, which means that sellers are losing their power. Due to this, there is a chance of seeing a bounce off to the closest resistance area at $0.3077 by the end of August.
XRP is trading at $0.2844 at press time.


