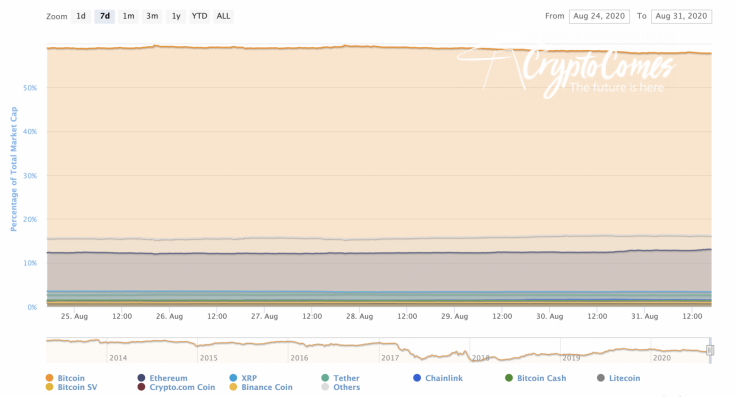
The bullish mood has remained on the market since the weekend as Chainlink (LINK) is the only coin from the Top 10 list that is located in the red zone.

Meanwhile, the market share of Bitcoin (BTC) has declined by 2% over the last week and is now 57.8%.
The relevant Litecoin data today:
-
Name: Litecoin
-
Ticker: LTC
-
Market Cap: $4,059,570,483
-
Price: $62.12
-
Volume (24h): $2,655,226,537
-
Change (24h): 1.54%
The data is relevant at press time.
LTC/USD: When can bulls reach the $65 mark?
Litecoin (LTC) is no exception to the rule as the rate of the "digital silver" has also risen over the last day. The growth has accounted for 1.54%, however, the price change over the last week has been -0.15%.
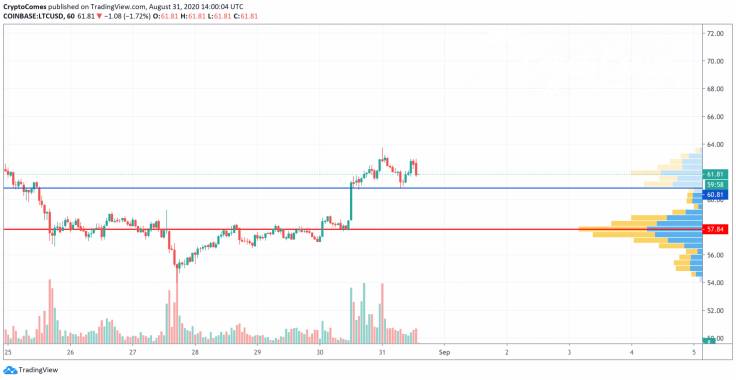
On the hourly chart, Litecoin (LTC) has entered a short-term correction period as bears have seized the initiative, which is confirmed by a high selling trading volume and low liquidity. In this regard, the drop may last to the closest support at $60.81 and may be attained by the end of the week.
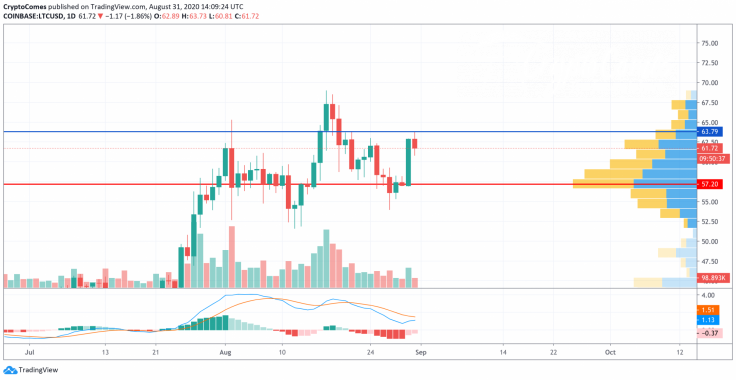
On the daily chart, Litecoin (LTC) is bullish as the last candle has confirmed the presence of buyers and their attempt to keep rising in the long term. Thus, the lines of the MACD indicator are about to enter the green zone which will indicate the end of the bearish cycle. The main target in this case is the resistance above $63.
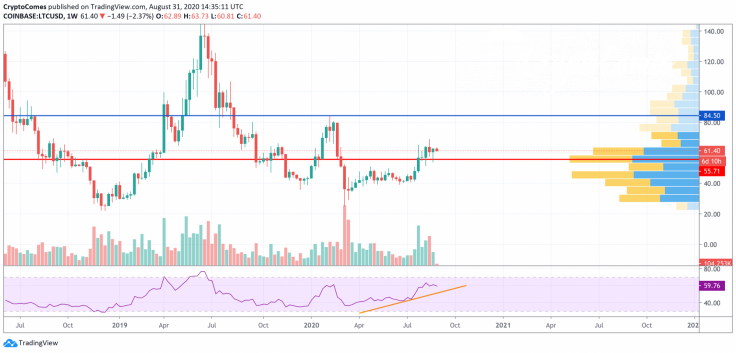
On the weekly time frame, the long-term bullish trend has just begun. The buying trading volume is increasing which means that bulls have not reached their main targets yet. The Relative Strength Index is not in the overbought zone, considering the high chances of seeing the rate higher. If that happens, the main target is around $84.
Litecoin is trading at $61.36 at press time.


