The cryptocurrency market has become more bearish over the last day. Bitcoin Cash (BCH) and Binance Coin (BNB) are the only coins from the Top 10 list that are still located in the green zone.
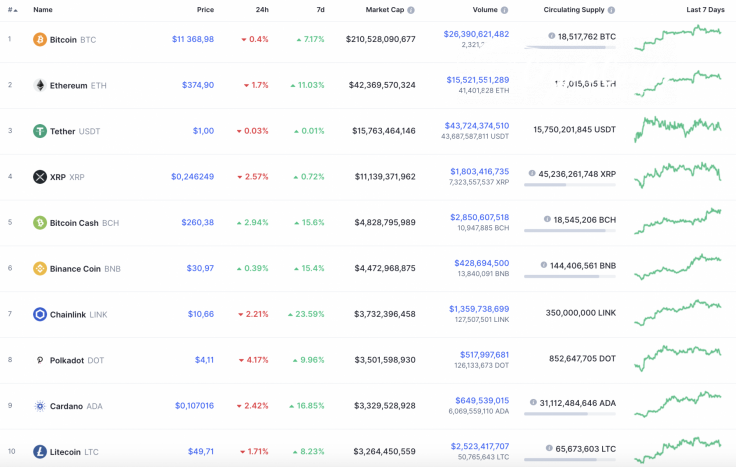
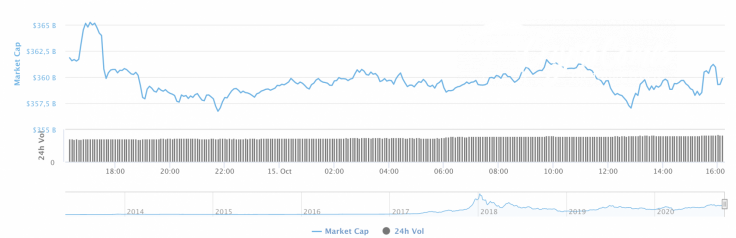
However, the drop in most of the coins has practically left the total cryptocurrency capitalization index unaffected. Currently, it accounts for $360 bln.
The relevant data for Ethereum is looking the following way:
-
Name: Ethereum
-
Ticker: ETH
-
Market Cap: $42,428,351,662
-
Price: $375.42
-
Volume (24h): $16,820,794,515
-
Change (24h): -1.32%
The data is relevant at press time.
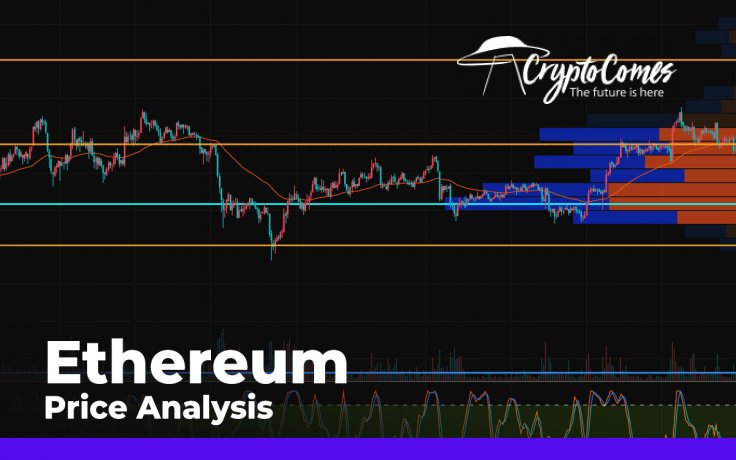
ETH/USD: Do bulls have the power for one more push to $400?
Yesterday afternoon, the volume of Ethereum (ETH) sales increased slightly and the bears tried to knock the pair out of the sideways range, which was located at the level of $380. However, the two-hour EMA55 stopped the weak onslaught of sellers and returned the ETH price to the $380 mark.
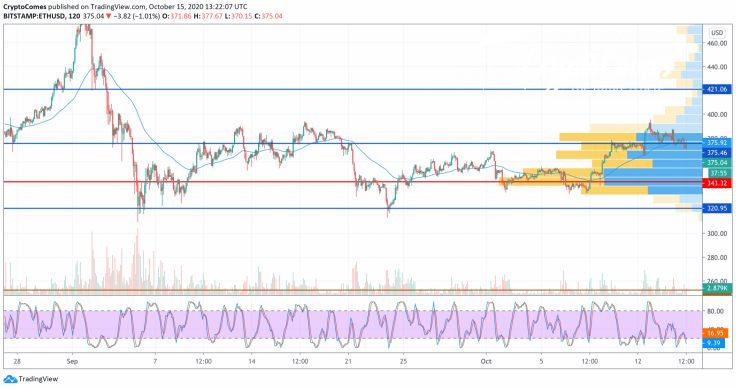
If bearish sentiment intensifies today, the price may drop to the support of $360, but buyers will try to keep the pair in the area of average prices.
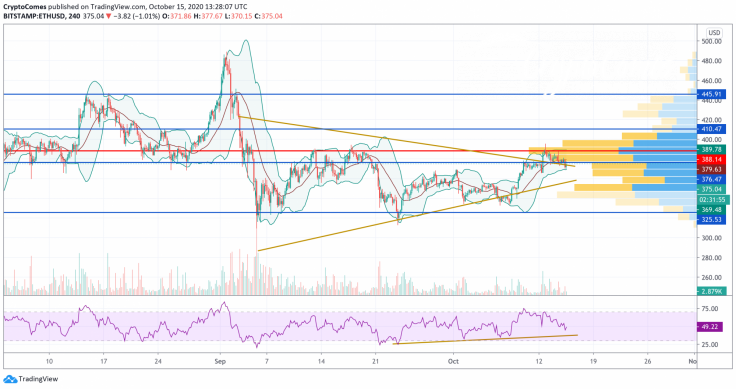
On the 4H chart, the quotes have broken through the upper border of the "triangle" model, which gives reason to consider further growth to the level of $450 as part of the pattern development.
However, one should not exclude a correction with a test of the upper boundary of the model and continued growth. The described option will also be supported by a rebound from the support line on the RSI indicator, where the previous test provoked a breakdown of the upper border of the "triangle" model.
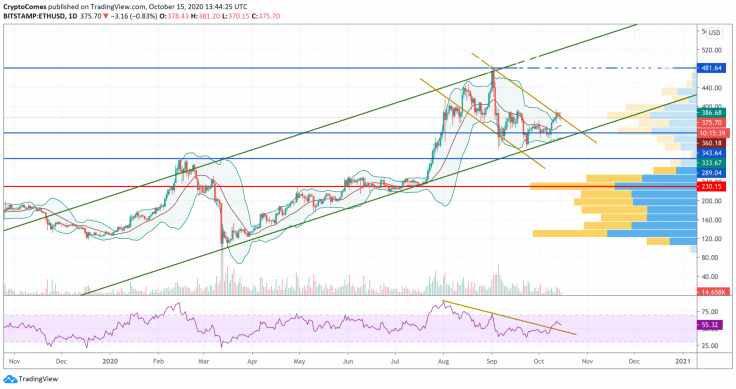
ETH/USD quotes on the daily chart were able to push off the support level. With the breakdown of the upper border of the descending channel and price-fixing above the level of $397, one can expect the development of the upward movement and the continuation of the "5-0" pattern. A strong signal in favor of the growth of quotations is the breakdown of the downward trend line on the RSI indicator. The indicator values have already begun to return to the broken line, after which we can consider the subsequent rise in the asset price.
Ethereum is trading at $376.25 at press time.


