The situation on the cryptocurrency market has slightly improved as some coins have come back to the green zone. Mainly, Binance Coin (BNB) and Ethereum (ETH) are the top gainers, rising by 2.7% and 0.8% respectively.
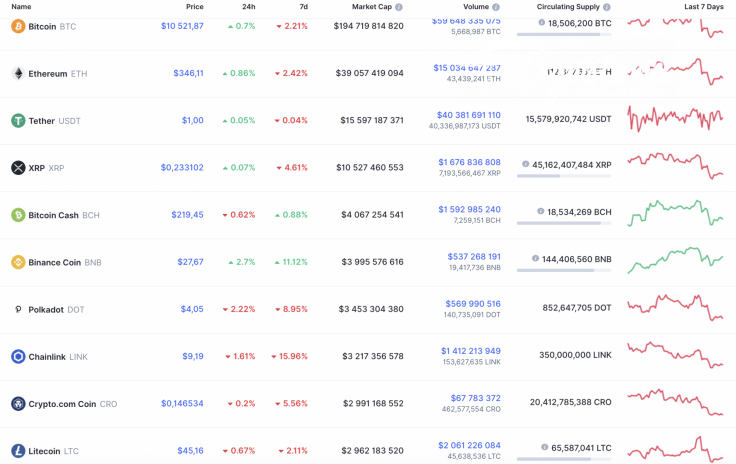
The main data on Binance Coin (BNB), Stellar (XLM) and Tron (TRX):
|
Name |
Ticker |
Market Cap |
Price |
Volume (24h) |
Change (24h) |
|
Binance Coin |
BNB |
$3,995,576,616 | $27.67 | $537,268,191 | 2.7% |
|
Stellar |
XLM |
$1,479,903,001 | $0.071279 | $146,355,787 | -0.04% |
|
TRON |
TRX |
$1,905,726,543 | $0.026594 | $1,321,556,601 | 7.04% |
BNB/USD
Binance Coin (BNB) is the top gainer among 10 other cryptocurrencies. The rate of the digital asset has increased by 11.12% over the previous 7 days.
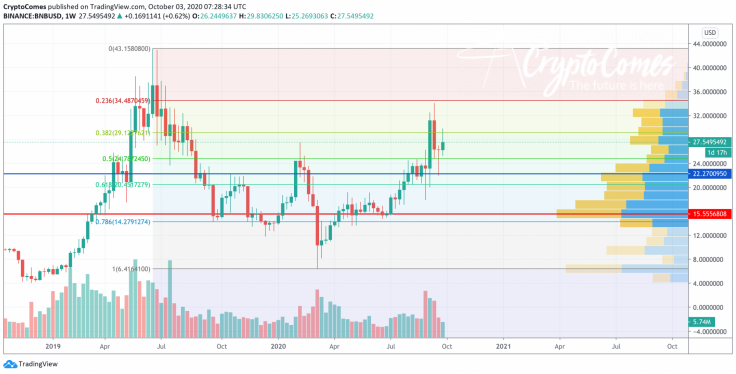
On the weekly chart, Binance Coin (BNB) has entered the correction phase after growth began at the end of March. Even though the bullish trend remains relevant long-term, an ongoing drop may continue.
Applying the Fibonacci retracement to the chart, the decline may continue to the 61.8% level, which corresponds to $20.45, where bulls may seize the initiative.
Binance Coin is trading at $27.63 at press time.
XLM/USD
Stellar (XLM) has shown much worse performance over the last week than Binance Coin (BNB). The decline has made up 6.42%, while the price since yesterday has constituted -0.04%.
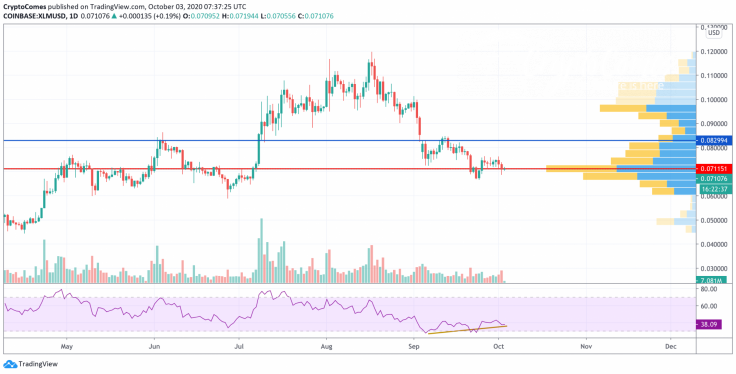
Stellar (XLM) has formed a bullish divergence on the daily time frame. It is too early to consider a trend reversal; however, short-term growth is possible. As part of the potential bounce off, the rate of the altcoin may rise to the closest resistance at $0.082, where a false breakout is likely to occur.
Stellar is trading at $0.0711 at press time.
TRX/USD
Tron (TRX) is the main winner today, as the price of the coin has rocketed by 7% just over the past 24 hours.
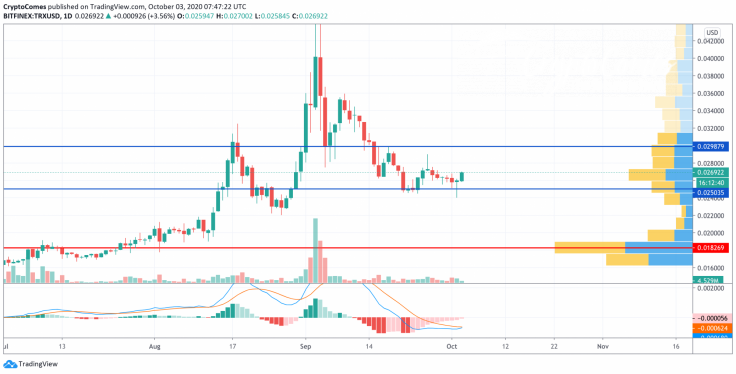
On the daily chart, Tron (TRX) is trying to grow after a dump to $0.025, where it made a false breakout. The trading volume is at the lowest levels, which means that traders are solidifying their positions before an upcoming price blast. From the technical point of view, growth is more likely than a drop, which is confirmed by the rising lines of the MACD indicator that are about to enter the bullish zone. If that happens, buyers may get the rate of Tron (TRX) to $0.029 soon.
TRX is trading at $0.026 at press time.


