

Bakkt decision to start testing its physically delivered Bitcoin futures has not positively influenced the cryptocurrency market. Litecoin is the biggest loser among the general market decline, its rate has decreased by more than 5%. However, Bitcoin SV is the exception from the rule, as its quotes located in the green zone.

Against the market decline, Bitcoin has set new hash rate record on July 20, having peaked at 79 tera hashes per second.
BTC/USD
The leading cryptocurrency could not fix above $10,500 and now moving towards the psychological $10,000 mark.
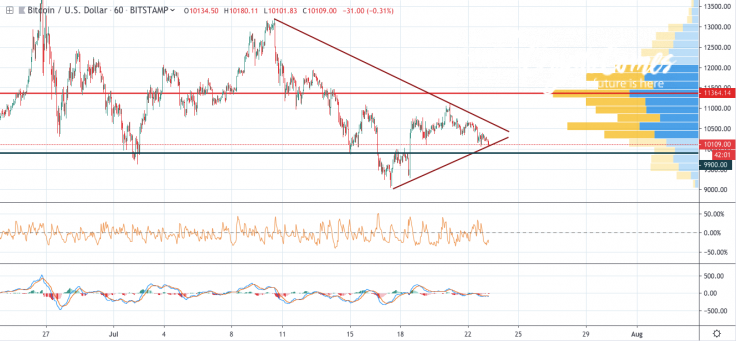
On the 1H chart, Bitcoin is looking bearish due to the low trading volume and declining MACD indicator. Respectively, there are no prerequisites for further growth. In terms of a short-term scenario, the price will be located between the support at $9,900 and resistance at $10,100.

The price of BTC is trading at $10,116 at the time of writing.
ETH/USD
Ethereum is falling even faster than Bitcoin, going down by 4.5% over the last 24 hours. Currently, it is the biggest loser compared to other top 3 coins.
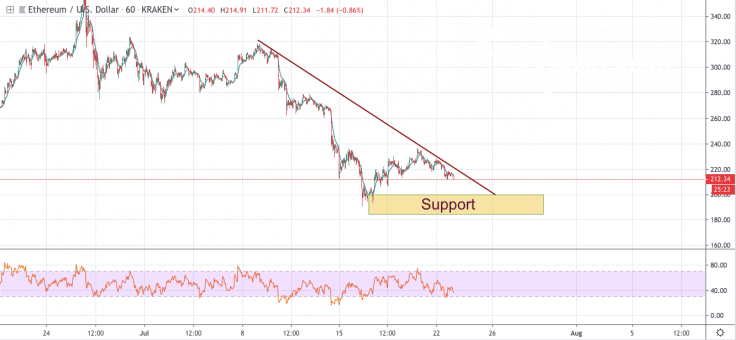
The chief altcoin broke the support at $220 and now moving to retest the vital $200 mark. Analyzing the hourly chart, nothing can stop Ethereum from a further decline. The lines of the RSI indicator are going down, suggesting that sellers have not run out of steam yet. Once $200 is reached, traders might think about a possible reversal, but not a fast bounceback.
The price of ETH is trading at $212.45 at the time of writing.
XRP/USD
Ripple is the ’top gainer’ today, as its rate has decreased by 4.6% over the last day, which is the least decline compared to other top coins.
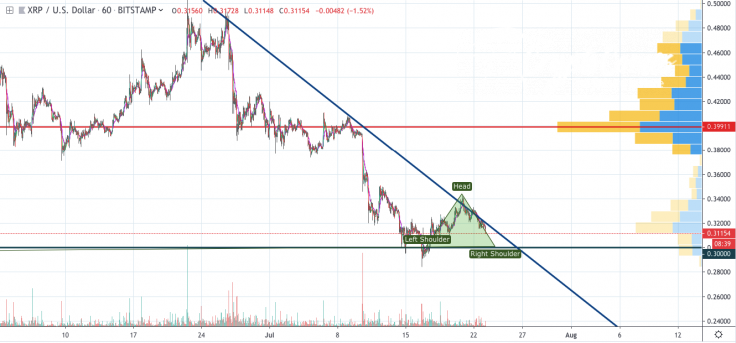
On the 1H chart, XRP is about to finish the formation of the Head and Shoulders pattern. In this case, the coin is going to retest the support at $0.30 in a few days. The declining trading volume confirms the bearish tendencies of Ripple.
The price of XRP is trading at $0.3115 at the time of writing.


