
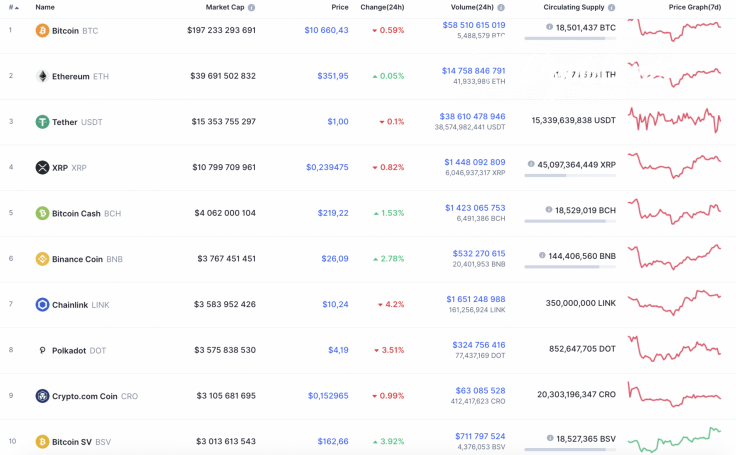
Bears have become more active by the end of the week as some of the Top 10 coins have switched to the red zone. Chainlink (LINK) is the main loser among the Top 10 coins, falling by 4.2%.
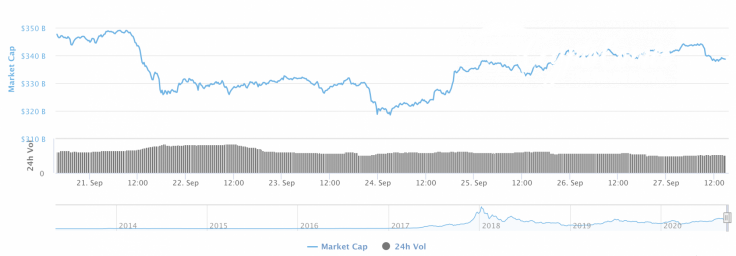
The relatively neutral mood of the cryptocurrency market the past week has negatively affected its total capitalization, which has lost around $6 bln and is now at $341 bln.
The relevant data for XRP today:
-
Name: XRP
-
Ticker: XRP
-
Market Cap: $10,800,903,031
-
Price: $0.239502
-
Volume (24h): $1,444,900,879
-
Change (24h): -0.87%
The data is relevant at press time.
XRP/USD: Can bulls hold the $0.24 mark next week?
The current week has been bearish for XRP, as the rate of the altcoin has dropped from $0.2470 to $0.24, where it is trading at the moment. Meanwhile, the coin has lost almost 1% of its share since yesterday.
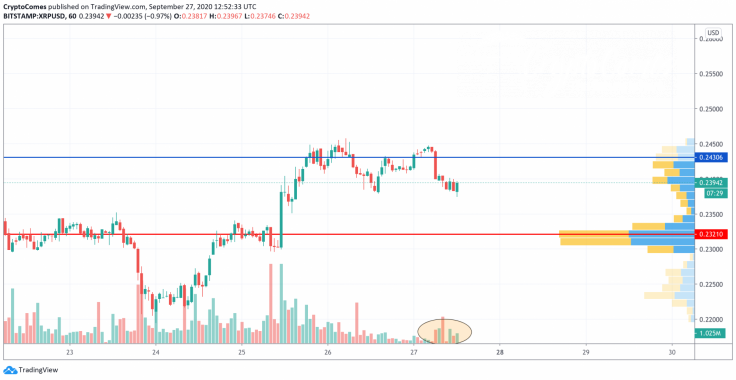
On the hourly chart, one may see an increasing trading volume, which means XRP may show short-term growth soon. If that happens, the rise may last until the coin reaches the local support at $0.2430. However, it is unlikely to keep growing as there is not enough liquidity. This means that there are fewer buyers that want to purchase XRP at the current prices.
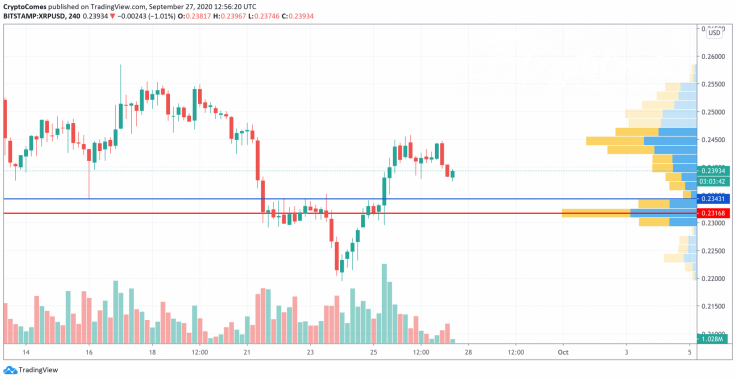
On the 4H time frame, buyers are trying to hold the rate of XRP above $0.24; however, they are unlikely to do that due to the declining trading volume.
Most of the liquidity is located in the area of $0.23, which means that there is the potential to see the rate of the altcoin there next week. Moreover, the so-called "mirror" level at $0.2343 serves as a magnet for XRP that confirms a possible price drop.
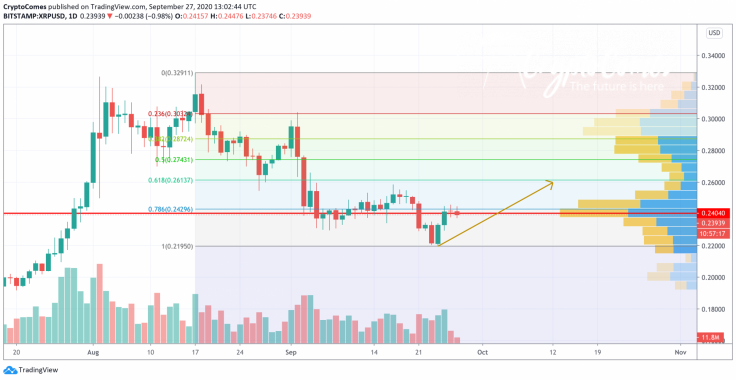
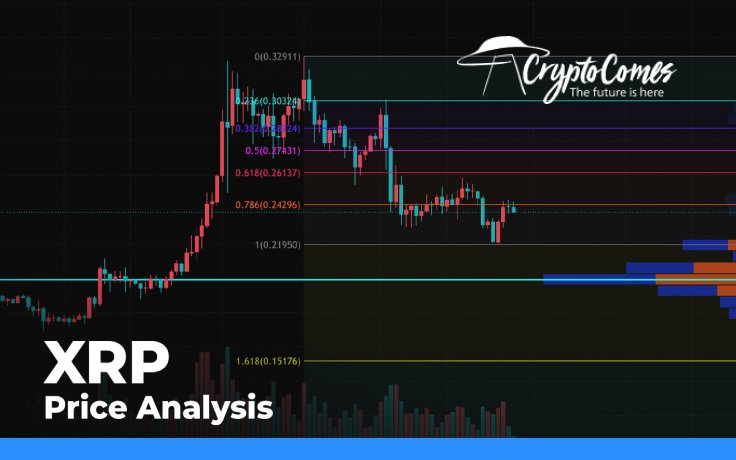
On the daily chart, the situation is the opposite. Bears are about to give up as the selling volume is decreasing. In addition, there is almost no liquidity in the range below $0.22. Applying the Fibonacci retracement on the chart, one needs to pay attention to the 61.8% that corresponds to $0.2613. If bulls hold above $0.24, the mentioned mark may be reached by mid-October.
XRP is trading at $0.2393 at press time.


