
After a sharp decline, a slight correction has arrived on the cryptocurrency market. As a result, all Top 10 coins are in the green zone, while Chainlink (LINK) is the top gainer among them, having added 16.59 percent over the last day.
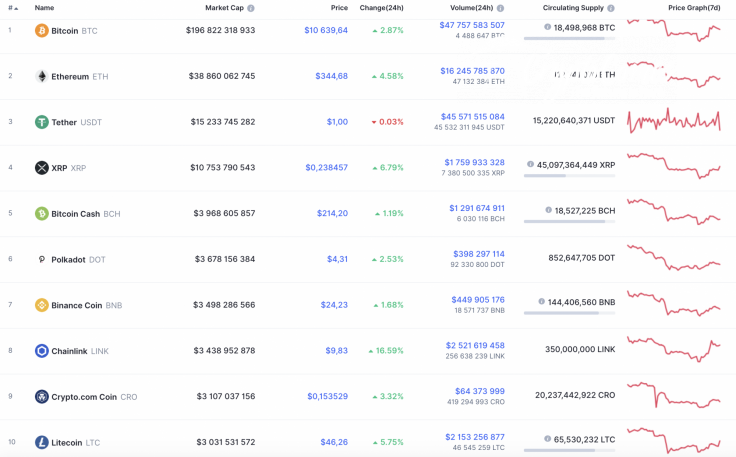
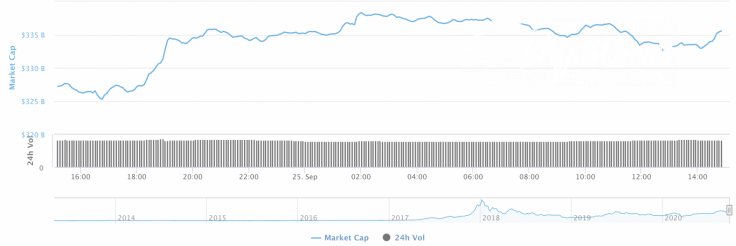
Due to the rise of most of the crypto assets, the total market capitalization has added $10 bln since yesterday. Now the index is at $337 bln.
The relevant data for Chainlink today:
-
Name: Chainlink
-
Ticker: LINK
-
Market Cap: $3,453,286,153
-
Price: $9.87
-
Volume (24h): $2,516,686,167
-
Change (24h): 16.59%
The data is relevant at press time.
LINK/USD: Can bulls hold the $10 mark?
Chainlink (LINK) has recovered from the fall faster than all other Top 10 coins. The price change over the last 24 hours has made up almost +17%.
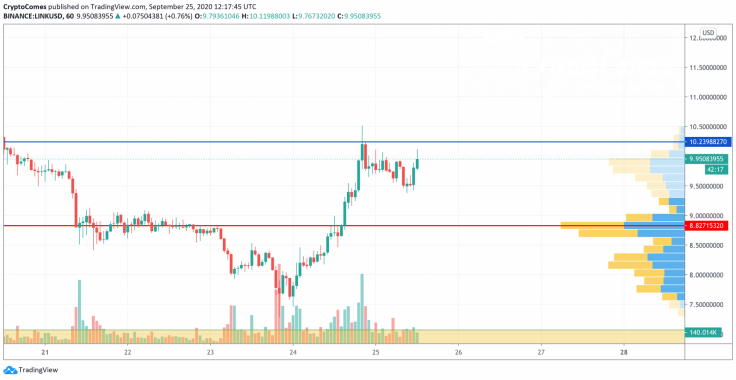
On the hourly chart, Chainlink (LINK) might have already finished the growth as the trading volume has decreased. Thus, liquidity is also low at the current levels, which means that the altcoin is unlikely to update the local peaks. However, at the moment, the price of the coin is going up. Traders may expect a false breakout of the $10.23 mark before an upcoming drop.
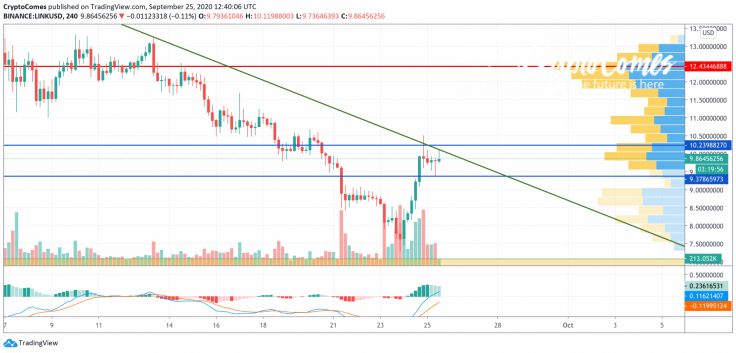
On the 4H time frame, the situation is rather more bearish than bullish. Chainlink (LINK) could not break the falling channel, having formed a false breakout. Thus, the lines of the MACD indicator are about to change to red, which will confirm bears' dominance.

That is why there is a high chance that the altcoin will retest the closest support zone at $9.37 in the near term.
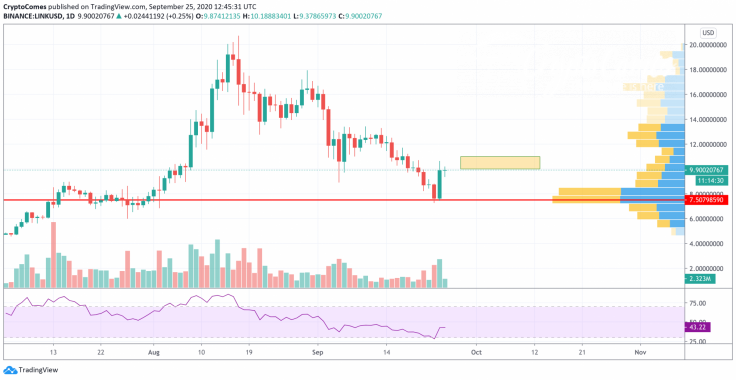
On the daily chart, the altcoin has bounced off the support at $7.50 and is now trying to fix above the important $10 mark. From the technical point of view, it might break above it; however, further growth is unlikely due to the declining trading volume. In this regard, the more probable scenario is sideways trading in the range between $10 and $11.
Chainlink is trading at $9.86 at press time.


