
With the last day of the week, the cryptocurrency market continues to rise as most of the Top 10 coins are in the green. The only exception to the rule is XRP, whose rate has gone down by 0.10% since yesterday.
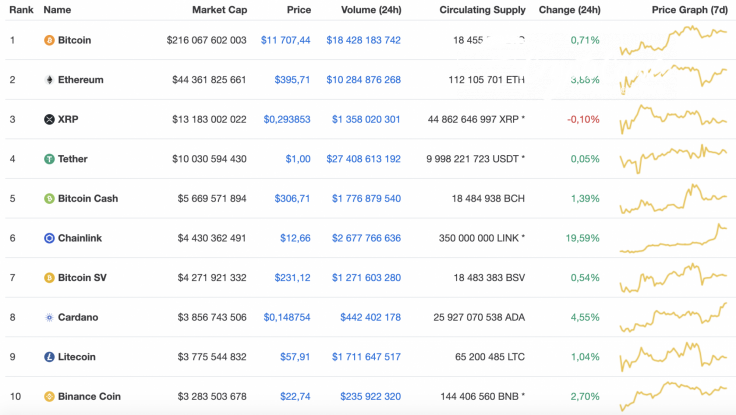
Below is the key information for Bitcoin (BTC), Ethereum (ETH), and XRP:
|
Name |
Ticker |
Market Cap |
Price |
Volume (24H) |
Change (24H) |
|
Bitcoin |
BTC |
$215,736,752,085 | $11,689.51 | $18,466,275,179 | 0.46% |
|
Ethereum |
ETH |
$44,334,466,218 | $395.47 | $10,284,568,325 | 3.68% |
|
XRP |
XRP |
$13,150,839,615 | $0.293136 | $1,358,894,618 | -0.41% |
BTC/USD
Bitcoin (BTC) could not stay above the $12,000 mark, confirming a high probability of a price drop below $11,000. The rate for the leading crypto has increased by 3.19% since last week.
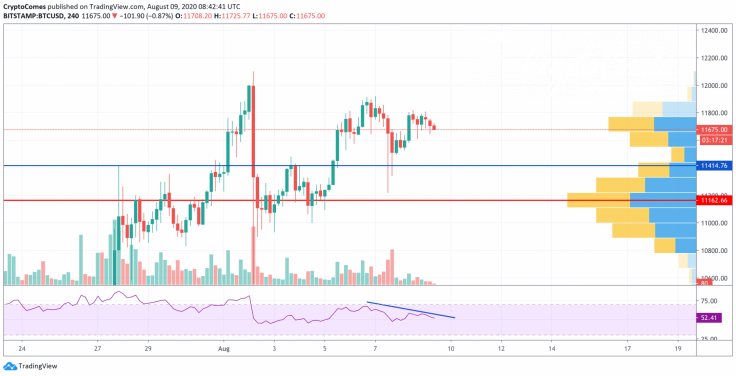
Looking at the 4H chart, Bitcoin (BTC) is slightly declining against the decreasing trading volume. At the moment, there is a low probability of seeing a reversal and a run to $12,000. On the Relative Strength Index (RSI), a bearish divergence has formed, which considers the ongoing drop. If the trading volume does not change and the liquidity remains the same, then BTC may inch closer to the $11,400 level by next week.
At press time, Bitcoin was trading at $11,685.
ETH/USD
The rate for Ethereum (ETH) has increased much more since last week than Bitcoin (BTC). The price change has constituted an increase of +3.19%.
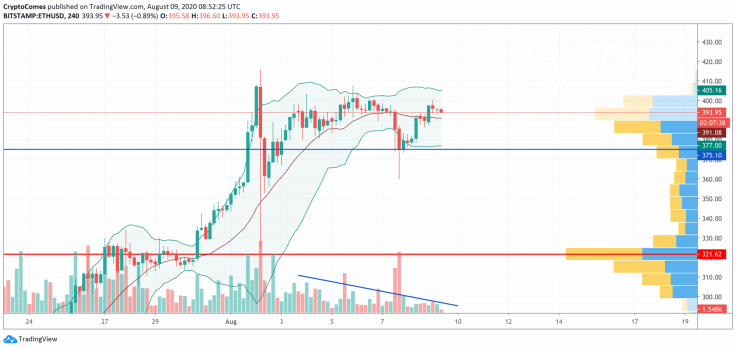
However, the bearish sentiments have started to appear. The trading volume also continues to decline, which means that a possible drop will likely happen soon. The long-term bullish scenario remains relevant; however, a correction is needed to gain enough strength for the further price rise. Applying the Bollinger Bands to the chart, the drop may continue to the support line at around $375. Such a price action is relevant through the end of the month.
At press time, Ethereum was trading at $11,716.
XRP/USD
XRP is the only crypto from the Top 3 list that is located that has been located in bearish territory for the last 24 hours. In terms of a price change from last week, the rate for XRP has remained relatively unchanged.
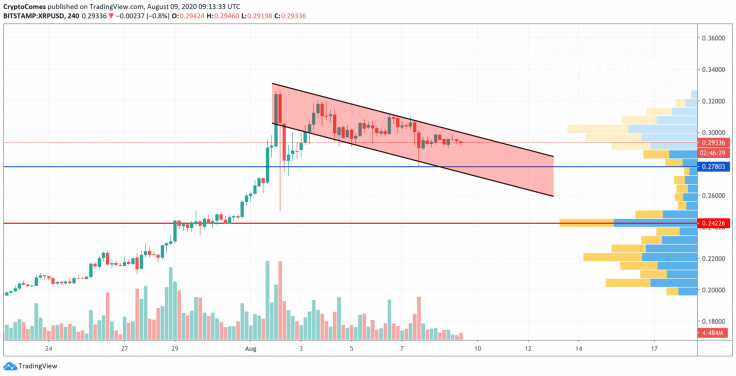
XRP is trading similarly to Bitcoin (BTC) and Ethereum (ETH) as the short-term scenario also remains bearish. Since the beginning of May, the third most popular altcoin has been located within the falling channel and there are no prerequisites for a trend change.
Thus, the buying trading volume remains at its lowest level. If XRP cannot push towards $0.30 and fix above it within the next few days, then the bears will push it back to $0.2783 by the end of the month.
At press time, XRP was trading at $0.2929.


