
Even though the cryptocurrency market is overbought to a certain extent, all of the top 10 coins are in the green zone. The biggest gainer is Ethereum (ETH), which has set a new peak this year.
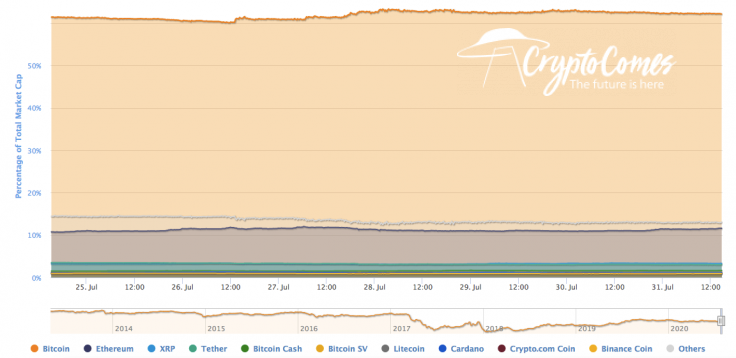
Meanwhile, the market share of Bitcoin (BTC) keeps slightly increasing as most of the altcoins are declining against the main crypto. The current dominance rate is 62.2%.
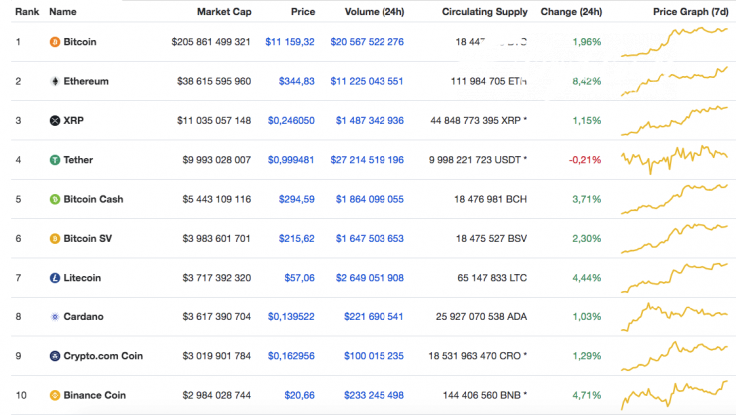
The key data for Bitcoin today:
-
Name: Bitcoin
-
Ticker: BTC
-
Market Cap: $206,723,245,130
-
Price: $11,206.02
-
Volume (24h): $20,656,476,070
-
Change (24h): 2.38%
The data is relevant at press time.
BTC/USD: Can Bitcoin fix above $11,000 by the end of the week?
Yesterday trading volumes were gradually decreasing, and the price of Bitcoin (BTC) spent the whole day in a sideways range, narrowing the amplitude of fluctuations. If the activity of market participants remains at a low level today, consolidation in the narrowing side corridor may continue.
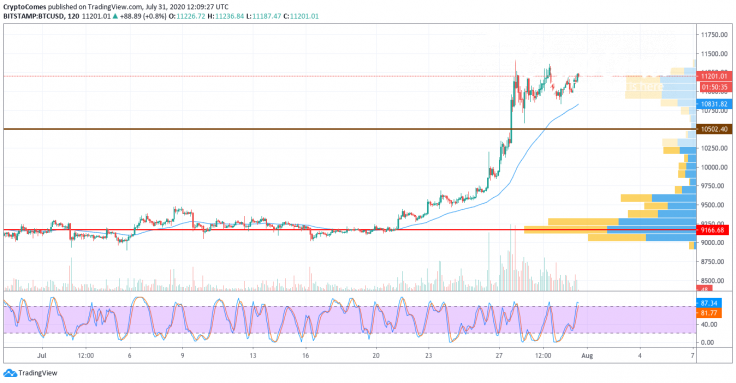
In the event of an insignificant sellers' advantage, the pair will only test the two-hour EMA55. If pressure from bears increases, a pullback to the support of $10,500 is possible.
Judging by the Stoch RSI indicator, price growth is less likely. However, one should not exclude the possibility of a false bullish impulse, which is capable of piercing the $11,395 level and marking a new monthly maximum in the area of $12,000 on the last day of July.

On the 4H time frame, bearish divergence has been formed on the RSI indicator. The rate of Bitcoin (BTC) is rising higher while trading volume decreases. Usually, this means that growth is not going to last for a long time and there is a high chance of a possible correction. If the main crypto cannot fix above $11,000 by the end of the week, traders may expect a drop to $10,500-$10,600 shortly.
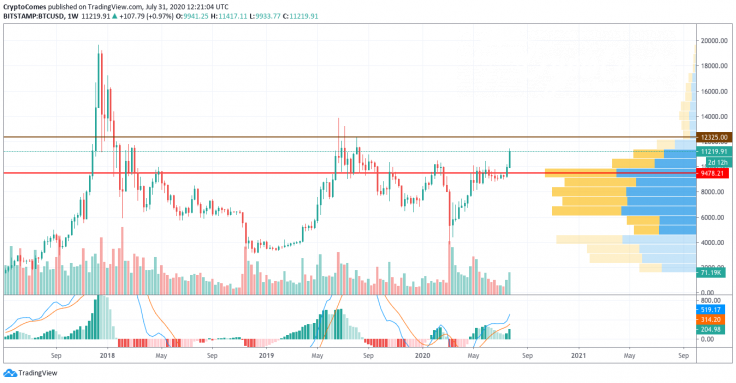
However, on the weekly chart, the situation is much more positive. The ongoing rise is accompanied by an increased trading volume, which means that growth is unlikely to be false. What's more, the lines of the MACD indicator are located in the green zone, confirming the bullish trend. In this case, the more likely option is continued growth to the next resistance at $12,325 by the end of summer 2020.
Bitcoin is trading at $11,210 at press time.


